Tech tip follow-up: Using the data Invoked with R's system command
In follow up to yesterday's discussion re invoking OS commands with R's system function, I wanted to show you just a bit of how straightforward it is to then use the resulting data.
After grabbing the Windows security event log with a call to Log Parser and writing it out to CSV, you have numerous options driven by what's interesting to you. Perhaps you're interested in counts per Event ID to say what your Top 10 events are. The issue is, that Log Parser just grabbed all of the security event log, which results in large, unwieldy CSV that includes large message data entries. No big deal, reduce the raw CSV to only data you need. As an example:
secevt <- read.columns("security.csv",c("EventID","TimeWritten","EventTypeName","Message"), sep=",")
This writes the EventID, TimeWritten, EventTypeName, Message columns into a new data frame, the contents of which are stored in secevt,the other 11 columns are no longer cluttering to the in-memory data set. Want to count Event IDs?
ct <- count(secevt$EventID)
Result snippet:
x freq
1 1108 734
2 4611 4
3 4616 1
4 4624 159
5 4634 49
6 4648 272
7 4656 2653
8 4658 1900
9 4662 27602
Want to sort that count decreasing by frequency?
srt <- ct[order(ct$freq, decreasing = TRUE), ]
Now to return the Top 10 specifically:
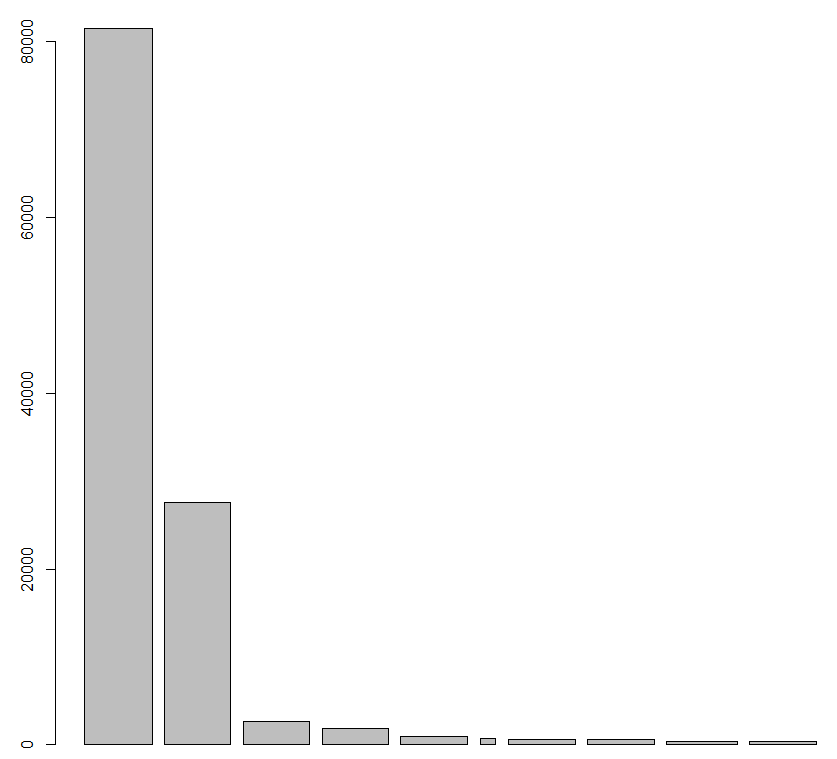
top10 <- head(srt,10)
Result snippet:
x freq
22 4703 81437
9 4662 27602
7 4656 2653
8 4658 1900
16 4690 931
1 1108 734
14 4688 618
15 4689 617
35 4957 400
11 4664 355
Bam, fast and flexible. My security event log has 81,437 Event ID 4703 (A user right was adjusted) entries, these parsed quickly from 118,154 total entries (147MB local file). How about visualizations of that same data? Yep, it all starts with something as simple as barplot(top10$freq,top10$x).
Hopefully you're intrigued regarding options and available capabilities here. Feel free to comment or email me if you'd like further information or resources with which to start exploring R.
Cheers.

Comments