Install & Configure Filebeat on Raspberry Pi ARM64 to Parse DShield Sensor Logs
Follow the step-by-step instructions provided [1] to install our DShield Sensor using Raspberry Pi Imager with Raspberry Pi OS Lite (64-bit). The following are the scripts used to parse the data published in this diary [4]. Al the scripts part of this diary are listed here with my other Elasticsearch projects.
Some of the recent changes implemented in the DShield Sensor, no longer save the web data into the sqlite database. These are the steps to save the weblogs into sqlite database and are also listed in the sqlite.sh script used to parse and dump the weblogs:
$ sudo cp -r ~/dshield/srv/www /srv
Add the following webpy service to the DShield sensor (with using vi or nano) and save the script:
$ sudo vi /lib/systemd/system/webpy.service
[Unit]
Description=DShield Web Honeypot
After=systemd-networkd-wait-online.service
Wants=systemd-networkd-wait-online.service
[Service]
Type=idle
WorkingDirectory=/srv/www/bin
User=cowrie
StandardOutput=syslog
StandardError=syslog
SyslogIdentifier=webpy
ExecStart=/usr/bin/python3 /srv/www/bin/web.py
[Install]
WantedBy=multi-user.target
Save the file webpy.service and complete the setup with the following command:
$ sudo ln -s /lib/systemd/system/webpy.service /etc/systemd/system/multi-user.target.wants/webpy.service
$ sudo chown -R cowrie:root /srv/www/DB
$ sudo systemctl enable webpy.service
$ sudo systemctl start webpy.service
$ sudo systemctl status webpy.service
Setup DShield Sensor Filebeat
After completing the installation of the SQLite database, add the following ARM64 Filebeat packages to the Pi to send the logs the Elasticsearch.
Installing ARM64 Filebeat package using [3] the following commands:
$ wget -qO - https://artifacts.elastic.co/GPG-KEY-elasticsearch | sudo apt-key add -
$ sudo apt-get install apt-transport-https
$ echo "deb https://artifacts.elastic.co/packages/8.x/apt stable main" | sudo tee -a /etc/apt/sources.list.d/elastic-8.x.list
$ echo "deb https://artifacts.elastic.co/packages/oss-8.x/apt stable main" | sudo tee -a /etc/apt/sources.list.d/elastic-8.x.list
$ sudo apt-get update && sudo apt-get install filebeat
Download the updated filebeat.yml file that will forward the logs the Elasticsearch:
$ sudo curl https://handlers.sans.edu/gbruneau/elk//DShield/filebeat.yml -o /etc/filebeat/filebeat.yml
Edit the filebeat.yml file and change the IP address to the logstash parser (192.168.25.23):
$ sudo vi /etc/filebeat/filebeat.yml
Start Filebeat
$ sudo systemctl enable filebeat
$ sudo systemctl start filebeat
$ sudo systemctl status filebeat
Setup Logstash Collection & Parsing
Install logstash and configure with the following 4 scripts in the /etc/logstash/conf.d
$ sudo curl https://handlers.sans.edu/gbruneau/elk/DShield/logstash-200-filter-cowrie.conf -o /etc/logstash/conf.d/logstash-200-filter-cowrie.conf
$ sudo curl https://handlers.sans.edu/gbruneau/elk/DShield/logstash-202-filter-cowrie-sqlite.conf -o /etc/logstash/conf.d/logstash-202-filter-cowrie-sqlite.conf
$ sudo curl https://handlers.sans.edu/gbruneau/elk/DShield/logstash-300-filter-iptables.conf -o /etc/logstash/conf.d/logstash-300-filter-iptables.conf
$ sudo curl https://handlers.sans.edu/gbruneau/elk/DShield/logstash-900-output-elastic.conf -o /etc/logstash/conf.dlogstash-900-output-elastic.conf
These 4 files are used to merge the logs to cowrie.* in the Elasticsearch server. Edit the three logstash configuration files and changed the DNS IPs to match your own network (logstash-200-filter-cowrie.conf, logstash-202-filter-cowrie-sqlite.conf and DShield/logstash-300-filter-iptables.conf). Look for: nameserver => [ "192.168.25.2", "192.168.25.3" ]
Edit the logstash-900-output-elastic.conf and change the domain (can be an IP) and the SSL certificate (if you are using it) to the Elasticsearch server location (remote.ca):
$ sudo vi /etc/logstash/conf.dlogstash-900-output-elastic.conf
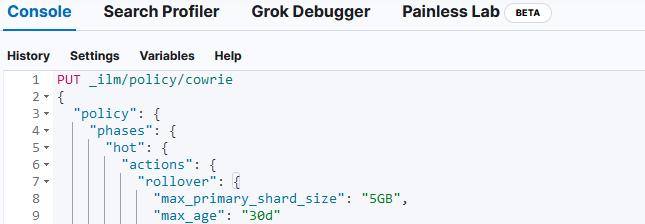
Download and apply these four Elasticsearch mapping templates using the the Console in Dev Tools to install them (copy/paste/apply):
https://handlers.sans.edu/gbruneau/elk//DShield/cowrie.txt
https://handlers.sans.edu/gbruneau/elk//DShield/cowrie-dshield.txt
https://handlers.sans.edu/gbruneau/elk//DShield/cowrie-sqlite.txt
If you don't have any replica (single server), make sure you change the 1 to a 0 before applying the policy. Repeat this for all 3 policies.
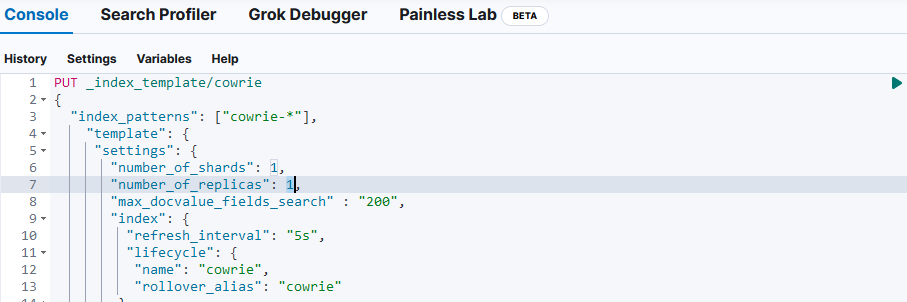
Import each policy
After the policiies and templates are imported, it is time to start Logstash. If successful, logstash will create the Indices under Index Management.
$ sudo systemctl enable logstash
$ sudo systemctl start logstash
$ sudo systemctl status logstash
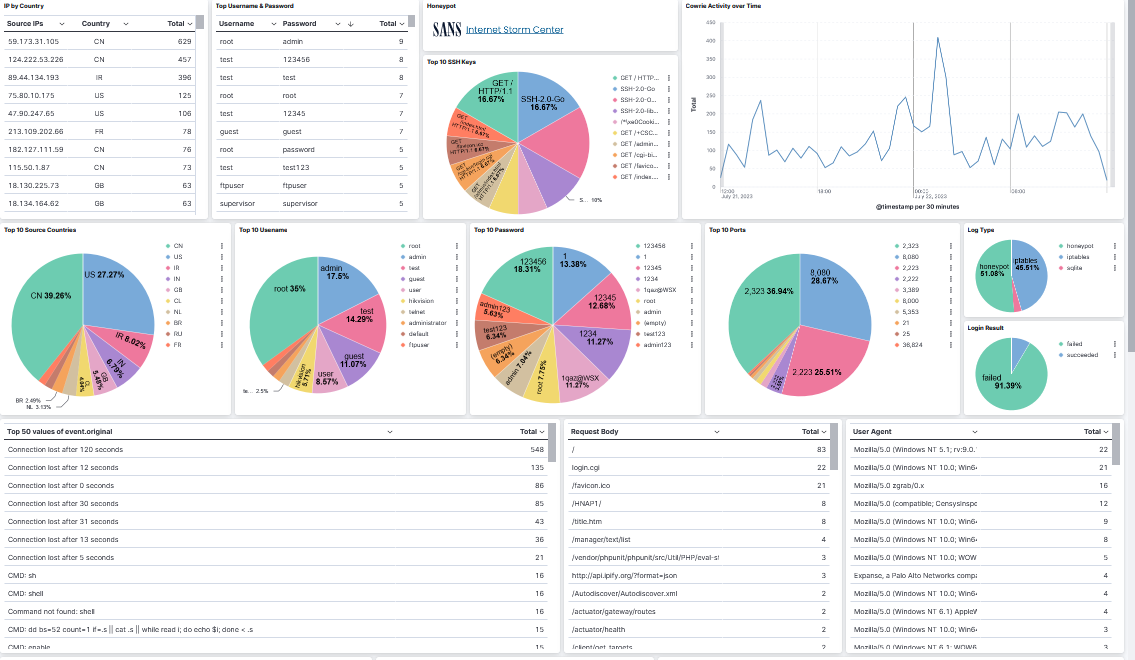
Last part is to dowload and import dshield_sensor_8.71.ndjson into Kibana in Stack Management → Saved Objects to have the dashboard available for viewing the data under Dashboard → [Logs DShield Sensor] Overview.
This step gets a copy of the weblogs hourly for filebeat to add them to Elasticsearch. While on the DShield sensor in your home user directory, download and install the Bash script as follow:
$ mkdir scripts
$ cd scripts
$ mkdir sqlite
$ wget https://handlers.sans.edu/gbruneau/elk/DShield/sqlite.sh
$ chmod 755 sqlite.sh
# Add this line to the crontab to run hourly which will save the logs in ~/sqlite and save the change
$ crontab -e
# Dump the cowrie web logs every hours
0 * * * * /home/guy/scripts/sqlite.sh > /dev/null 2>1&
The output will look like this and is parsed by the logstash parser:

It may take a little while before the weblogs are logged into the sqlite database. However, the following commands can be used to dump to a file the weblog that have been captured since it was started:
sqlite3 /srv/www/DB/webserver.sqlite '.mode insert' 'SELECT strftime("%d-%m-%Y %H:%M", "date", "unixepoch"), address,cmd, path, useragent from REQUESTS' | sed "s/..n',char(10)),//g" | awk '{gsub(/\\n/," ")}1' >> ~/request.sql
sqlite3 /srv/www/DB/webserver.sqlite '.mode insert' 'SELECT strftime("%d-%m-%Y %H:%M", "date", "unixepoch"), address, cmd, headers, path from POSTLOGS' | sed "s/..n',char(10)),//g" | awk '{gsub(/\\n/," ")}1' >> ~/postlogs.sql
[1] https://isc.sans.edu/tools/honeypot/
[2] https://www.elastic.co/downloads/beats/filebeat
[3] https://www.elastic.co/guide/en/beats/filebeat/8.8/setup-repositories.html#_apt
[4] https://isc.sans.edu/diary/DShield+Honeypot+Activity+for+May+2023/29932
[5] https://isc.sans.edu/diary/DShield+Sensor+JSON+Log+to+Elasticsearch/29458
[6] https://isc.sans.edu/diary/DShield+Sensor+JSON+Log+Analysis/29412
[7] https://isc.sans.edu/diary/DShield+Honeypot+Maintenance+and+Data+Retention/30024/
[8] https://github.com/jslagrew/cowrieprocessor/blob/main/submit_vtfiles.py
[9] https://handlers.sans.edu/gbruneau/elk/DShield/dshield_sensor_8.71.ndjson
[10] https://handlers.sans.edu/gbruneau/elastic.htm
-----------
Guy Bruneau IPSS Inc.
My Handler Page
Twitter: GuyBruneau
gbruneau at isc dot sans dot edu

Comments
newwhitebear
Jul 24th 2023
9 months ago
Guy
Jul 24th 2023
9 months ago
One thing I noticed, the sql logs part of filebeat.yml is hardcoded with /home/guy/sqlite/sqlite directory. This and the cron job would need to be changed based on the user that is logged into the pi. For raspberry pi os, I think the default is `pi`.
Thanks again for this guide.
linuxdriver
Aug 5th 2023
8 months ago
linuxdriver
Aug 19th 2023
8 months ago