
ELK Dashboard for Pihole Logs
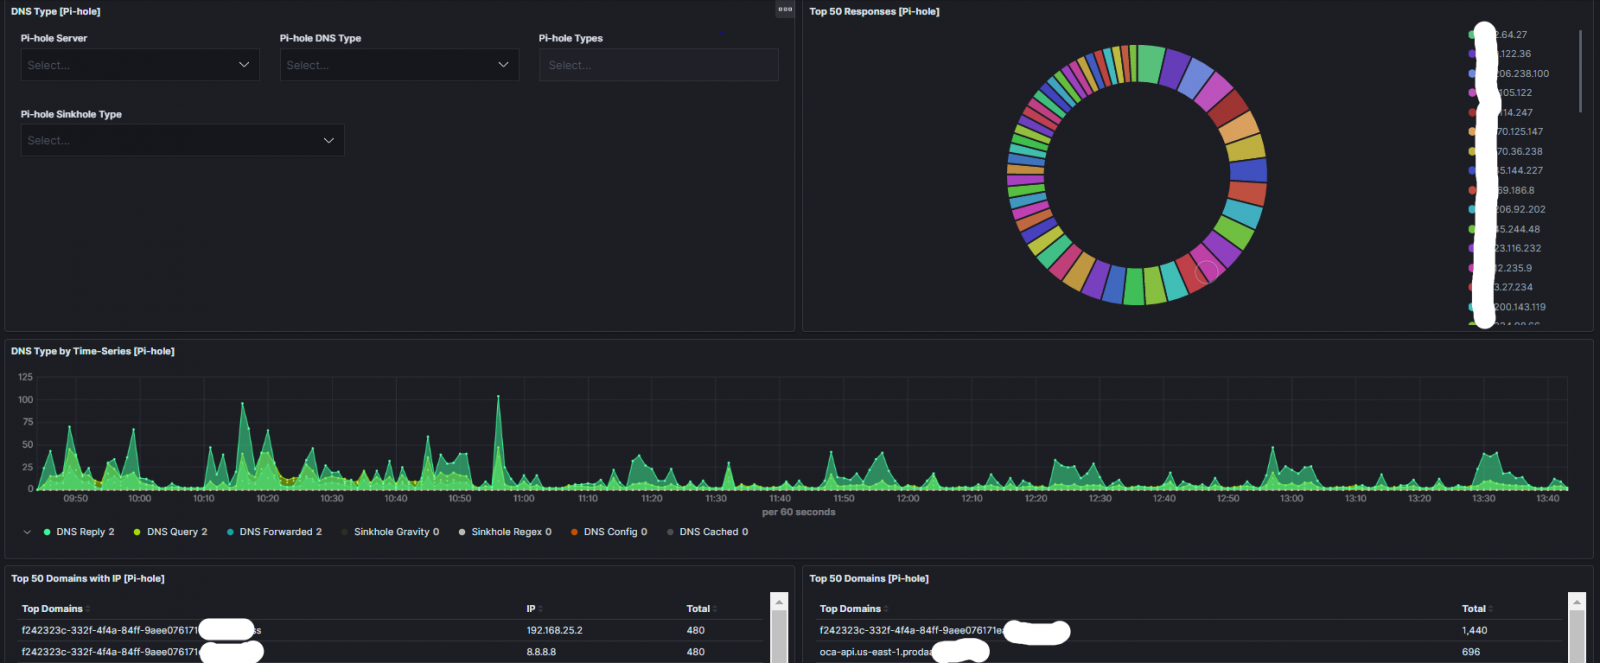
In my last Pihole Diary, I shared a Pihole parser to collect its logs and stored them into Elastic. In this diary, I'm sharing a dashboard to visualize the Pihole DNS data. Here are some of the output from the dashboard.
Pihole Overall
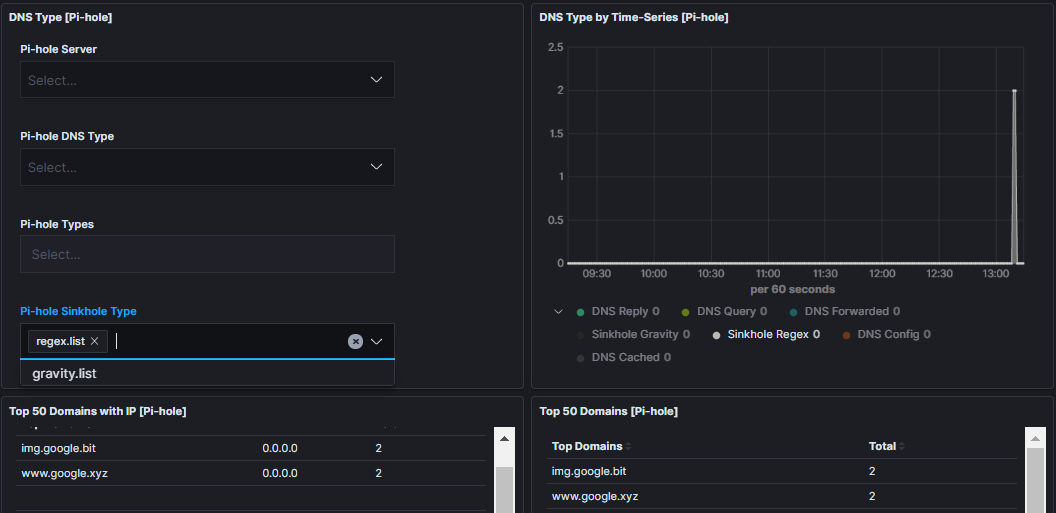
Pihole Regex List Match
This is the output from the Blocklist for Regex and Wildcard blocking
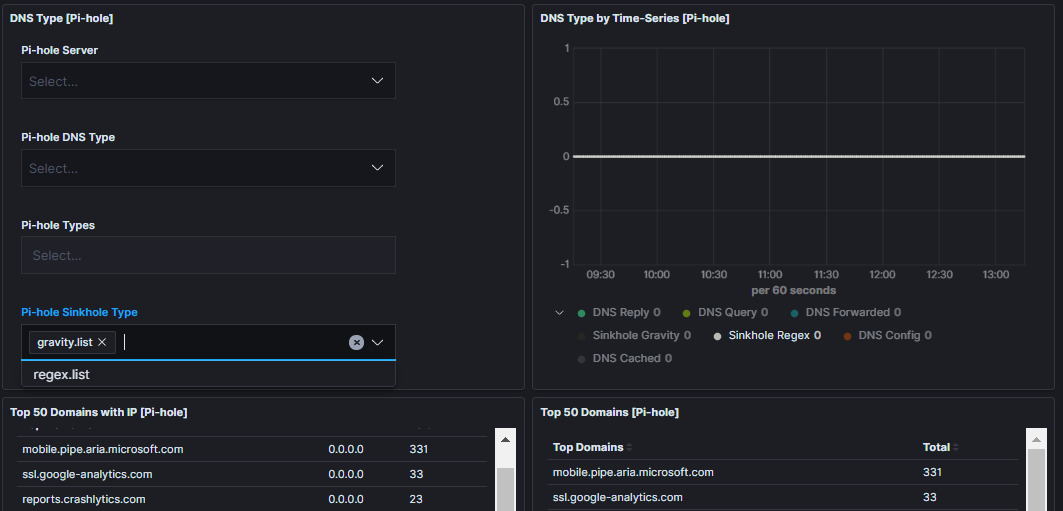
Pihole Gravity List Match
This is the output from the Blocklists generated by Pi-hole Gravity
The JSON dashboard file can be downloaded here.
[1] https://isc.sans.edu/diary/25582
[2] https://handlers.sans.edu/gbruneau/elk/pihole.conf
[3] https://handlers.sans.edu/gbruneau/elk/pihole_graphs.ndjson
[4] https://www.elastic.co/
-----------
Guy Bruneau IPSS Inc.
My Handler Page
Twitter: GuyBruneau
gbruneau at isc dot sans dot edu
×
![modal content]()
Diary Archives


Comments
1. What do you use to forward the syslog data from the pihole?
I have remote_syslog2 sending data to my home SOF-ELK instance https://github.com/papertrail/remote_syslog2, it works but all my log data isn't parsed
2. Can i use the remote_syslog2 in combination with this conf file? I'm still new to using elk stack and setting up these grok parsers, and i haven't figured out where to put this conf file, or i think maybe i have it in the right spot but it's not sending it in the right format.
3. Is it possible filebeats on a raspberry pi? i've tried but failed with some online guides.
Anonymous
Dec 29th 2019
5 years ago
filebeat.inputs:
- type: log
enabled: true
paths:
- "/var/log/pihole.log"
output.logstash:
hosts: ["127.0.0.1:5044"]
Refer this this diary: https://isc.sans.edu/diary/25582 I have published a logstash parser (to add under conf.d/pihole.conf) to send the data to ELK which can be downloaded here: https://handlers.sans.edu/gbruneau/elk/pihole.conf
I haven't tried to setup filebeat on a Rasberry pi but maybe someone else can answer that.
Anonymous
Dec 30th 2019
5 years ago
Anonymous
Dec 30th 2019
5 years ago